
 Home
Home News
News

- The token has crossed and sustained above the 50 EMA on the daily time frame.
- The pair of KLAY/USDT is trading at the price level of $0.2011 with a gain of 0.2% in the past 24 hours.
The token was in a long-term downtrend, with bears pushing the price down and forming lower highs and lower lows, however the downtrend came to a halt and the token was consolidating in a zone for a few weeks. The token has recently broken out of the consolidation zone in an upward direction.

KLAY token on the daily chart
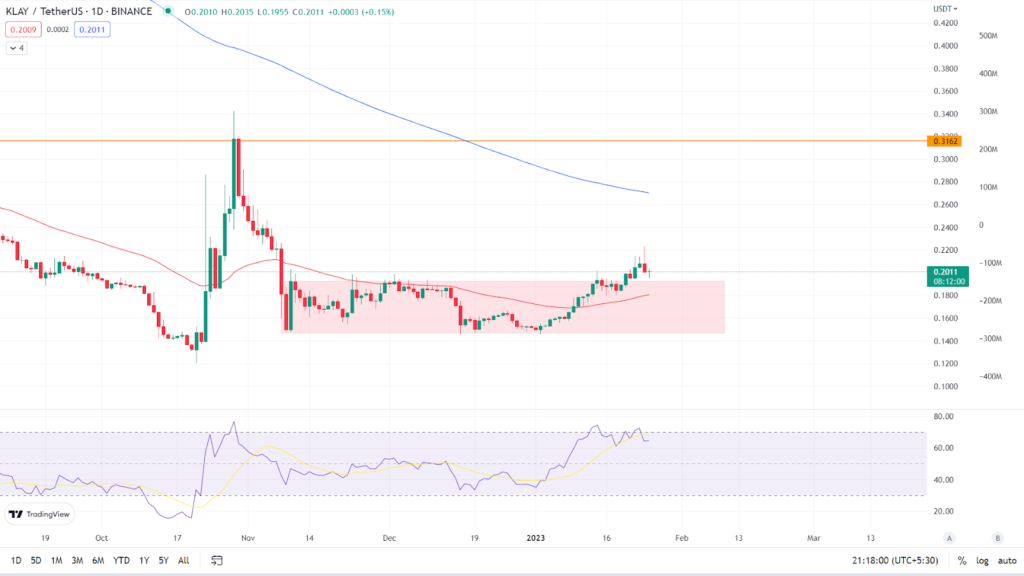
The token broke out of the range, but with low volume and a small breakout candle, and breakouts with low volumes are usually fake breakouts. According to the daily chart, KLAY token is currently trading at $0.2011, up 0.2% in the last 24 hours. It is now trading between its two major Moving Averages, the 50 EMA and the 200 EMA. (Red line is 50 EMA and the blue line is 200 EMA).

Relative Strength Index: The asset’s RSI curve is currently trading at 63.91 and is falling as the token forms a bearish candle on the daily time frame. The RSI curve has crossed below the 14 SMA. The token had an upward breakout, however the indicator is not showing bullish strength and does not support the breakout. If the token is not able to sustain the breakout and starts falling the value of the RSI curve will drop even further.
Analyst view & Expectations
The trend is uncertain because the possibilities of the breakout of the consolidation zone being a false breakout are higher. Investors are advised not to buy now and instead to wait for a clear indication before investing. Intraday traders, on the other hand, have a good opportunity to go short if the token is unable to sustain the breakout and returns to the consolidation zone, and book profits based on their risk to reward ratio.
According to our current Klay price prediction, the value of Klay will fall by -7.72% and hit $ 0.186161 in the next few days. Our technical indicators indicate that the current sentiment is bearish, with the Fear & Greed Index reading 51. (Neutral). Over the previous 30 days, Klay had 18/30 (60%) green days and 10.96% price volatility. According to our Klay forecast, now is not the time to buy Klay.
Technical Levels
Major support: $0.1927 & $0.1468
Major resistance: $0.2633 & $0.3162
Conclusion
The token produced a breakout of the consolidation zone, but the probability of the breakout being successful is low. Before acting, investors should wait for a clear indication.
Disclaimer: The views and opinions stated by the author, or any people named in this article, are for informational ideas only, and they do not establish the financial, investment, or other advice. Investing in or trading crypto assets comes with a risk of financial loss.

Nancy J. Allen is a crypto enthusiast, with a major in macroeconomics and minor in business statistics. She believes that cryptocurrencies inspire people to be their own banks, and step aside from traditional monetary exchange systems. She is also intrigued by blockchain technology and its functioning. She frequently researches, and posts content on the top altcoins, their theoretical working principles and technical price predictions.


