
 Home
Home News
News

- Polkadot price prediction suggests the sideways momentum of the token over the daily time frame chart.
- DOT crypto has recovered above 20, 50 and 100-days Daily moving Average while preparing for 200-days DMA.
- The pair of DOT/BTC is at 0.0002784 BTC with an intraday drop of 0.69%.
Polkadot price prediction suggests that DOT cryptocurrency has been trying to recover itself from the consolidation phase. Meanwhile, DOT ended up in the consolidation phase after gaining support from $4.27 and after the bullish rally DOT token started consolidating. DOT coin price needs to attract more buyers during the day’s trading session for the token to recover itself. DOT investors need to wait until the token breaks out from the consolidation phase.

Polkadot price was at $6.37 and has dropped by 1.51% of its market capitalization during the day’s trading session. Trading volume has dropped by 16% during the intraday trading session. This demonstrates that sellers are trying to revert the token towards the lower price range. Volume to market cap ratio is at 0.03583.

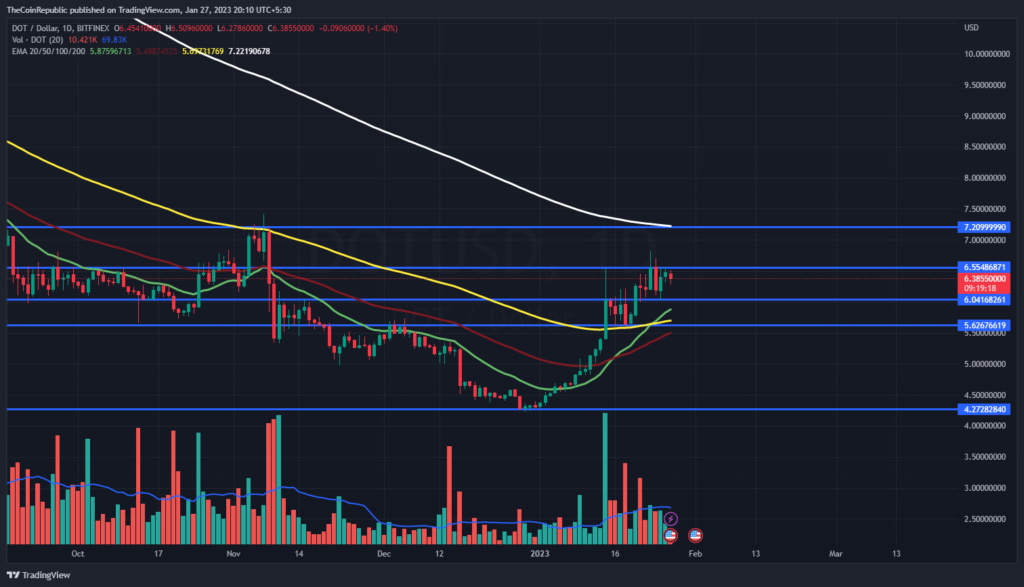
Polkadot price prediction suggests the token’s sideways momentum over the daily time frame chart. However, volume change can be seen below average and needs to grow for DOT to recover itself. Meanwhile, DOT crypto has recovered above 20, 50 and 100-days Daily moving Average while preparing for 200-days DMA. Polkadot cryptocurrency has gained 10.93% in the last week while Polkadot has gained around 43% in the period of a month.
What do Technical Indicators suggest about DOT?
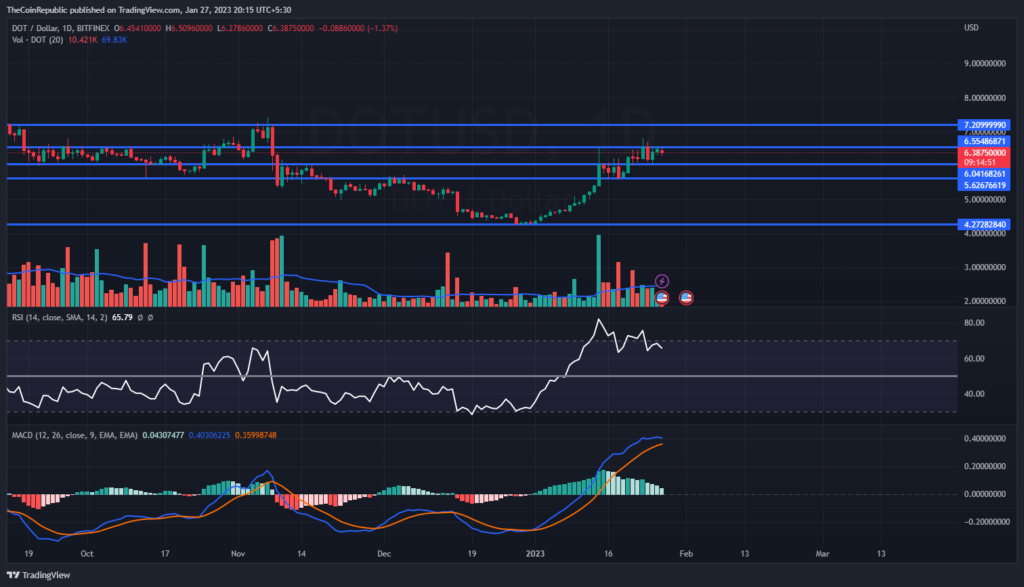
Polkadot cryptocurrency has been trying to sustain at the upper price range of the consolidation phase over the daily time frame chart. Technical indicators suggest the downtrend momentum of DOT crypto.
Relative Strength Index showcases the downtrend momentum of DOT crypto. RSI is at 66 and is heading towards neutrality. MACD exhibits the downside momentum of DOT token. The MACD line is about to cross the signal line downwards, registering a negative crossover. Investors in DOT cryptocurrency need to wait for any directional change over the daily time frame chart.
Summary
Polkadot price prediction suggests that DOT cryptocurrency has been trying to recover itself from the consolidation phase. Meanwhile, DOT ended up in the consolidation phase after gaining support from $4.27 and after the bullish rally DOT token started consolidating. Polkadot cryptocurrency has gained 10.93% in the last week while Polkadot has gained around 43% in the period of a month. Technical indicators suggest the downtrend momentum of DOT crypto. Investors in DOT cryptocurrency need to wait for any directional change over the daily time frame chart.
Technical Levels
Support Levels: $6.05 and $5.60
Resistance Levels: $6.55 and $7.20
Disclaimer
The views and opinions stated by the author, or any people named in this article, are for informational ideas only, and they do not establish financial, investment, or other advice. Investing in or trading crypto assets comes with a risk of financial loss.

Andrew is a blockchain developer who developed his interest in cryptocurrencies while pursuing his post-graduation major in blockchain development. He is a keen observer of details and shares his passion for writing, along with coding. His backend knowledge about blockchain helps him give a unique perspective to his writing skills, and a reliable craft at explaining the concepts such as blockchain programming, languages and token minting. He also frequently shares technical details and performance indicators of ICOs and IDOs.


