
 Home
Home News
News

- The token has shown bearish actions in the previous sessions.
- XEC token is trading above the demand zone on the daily time frame.
Ever since the launch of the XEC token it has been trading in a downtrend because of the unfavorable conditions in the cryptocurrency currency market. The token is gaining traction for the past few days, it remains to be seen if this is a trend reversal or just a retracement.

XEC token on the daily chart
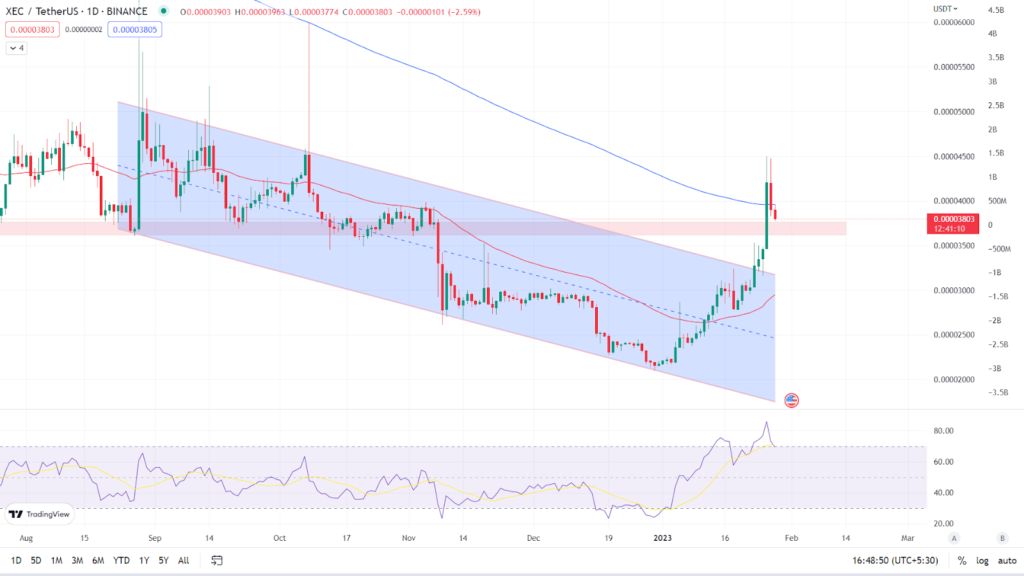
The token was trading in a downward parallel channel forming lower highs and lower lows, recently the token has given breakout of the channel in upward direction with high volume. According to the daily chart, the XEC token is currently trading at $0.00003803, indicating a loss of -2.53% in the last 24 hours. The token is facing resistance from the 200 EMA and is unable to break above it. It is trading between its two key Moving Averages, the 50 EMA and the 200 EMA. (Red line is 50 EMA and the blue line is 200 EMA).

Relative Strength Index:The asset’s RSI curve is currently at 69.95, and the value is dropping as the token forms a strong bearish candle on the daily chart. The rejection of the token by the 200 EMA has caused the RSI curve to decrease and cross below the 14 SMA. If the price of the token continues to decline, the value of the RSI curve will continue to fall even further.
Analyst view & Expectations
The token has shown strong positive momentum in recent days, and it is now trading above the demand zone on a daily time frame. The token was able to cross the 200 EMA but was unable to sustain the level on a daily chart. Investors are advised not to buy now and instead to wait for a clear indication before investing. Intraday traders, on the other hand, have a good opportunity to go short if the token goes below $0.00003615 and book profits based on their risk to reward ratio.
According to our current eCash (XEC) price prediction, the value of eCash (XEC) is expected to climb by 2.46% over the next few days, reaching $ 0.00003944. Our technical indicators indicate that the current sentiment is Neutral, with the Fear & Greed Index reading 52. (Neutral). Over the previous 30 days, eCash had 22/30 (73%) green days and 17.61% price volatility. According to our eCash forecast, now is not a good time to buy eCash.
Technical Levels
Major support: $0.00003615
Major resistance: $0.00004990
Conclusion
After a strong bullish momentum with bulls driving up the price of the token, it is now facing rejection from the 200 EMA. Investors are advised to wait for a clear indication before acting.
Disclaimer: The views and opinions stated by the author, or any people named in this article, are for informational ideas only, and they do not establish the financial, investment, or other advice. Investing in or trading crypto assets comes with a risk of financial loss.

With a background in journalism, Ritika Sharma has worked with many reputed media firms focusing on general news such as politics and crime. She joined The Coin Republic as a reporter for crypto, and found a great passion for cryptocurrency, Web3, NFTs and other digital assets. She spends a lot of time researching and delving deeper into these concepts around the clock, and is a strong advocate for women in STEM.


