
 Home
Home News
News

- Walmart Inc stock price is stuck inside the rising parallel channel
- WMT stock price is near to the 50 and 200 day EMA
- Walmart Inc stock technical indicators are turning bullish
Walmart Inc stock price is trading with mild bullish cues and bulls are trying to defend the 50 and 200 day EMA. However, it seems like WMT prices will lack direction until the Q4 earning is released.The previous week session was in the favor of bulls and it managed to defend the $138.00 support level but the coming week session will be difficult for the bulls. Currently, NYSE : WMT stock price is closed at $143.30 with the intraday gains of 0.77% and market cap stood at $386.451B

Will the Walmart stock breakout $150.00 hurdle ?
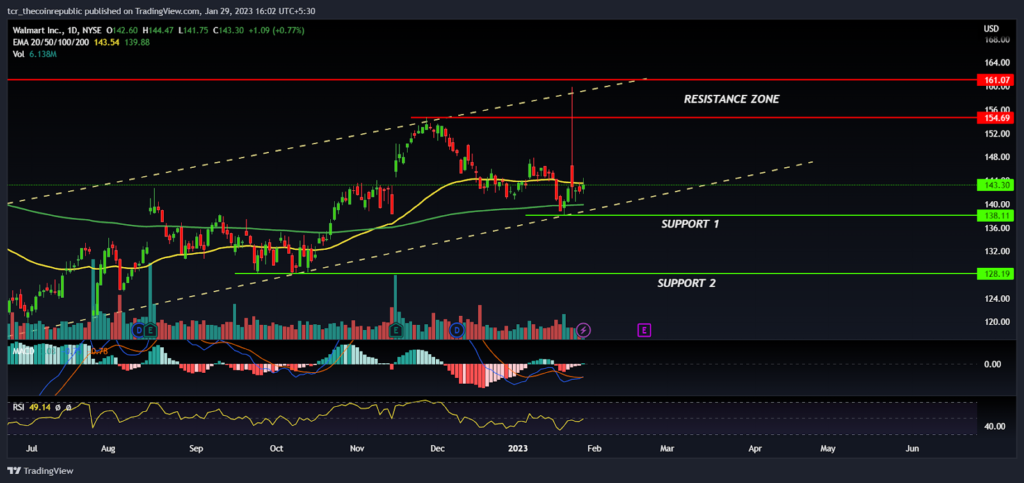
On a daily time frame, Walmart stock price is rising upward in parallel channels while forming higher high swings and bulls are trying to hold the prices above the 50 and 200 day EMA. In December, Walmart prices once attempted to break out of the $150 hurdle level but unfortunately due to heavy bear’s active in the supply zone prices were unable to sustain the higher levels and lost all its previous gains.

Recently, WMT stock price took support at the $138.00 and bounced back while forming a bullish reversal candle but prices were unable to continue the momentum and ended up consolidating in the narrow range. However, it seems like prices will consolidate for some more time before deciding the further direction.
Walmart Inc fundamentals are stagnant and from the past two quarters the company had reported a higher earnings as compared to the street estimates. According to the data in Trading View, NYSE : WMT Q4 earning estimates are $1.51 and the revenue estimates stood at $159.22B and if the company succeeds to beat the estimates we may see some upward surprises in the WMT prices.
The technical indicators of the WMT stock are turning bullish and the price action seems to be in the favor of bulls. The MACD is on the way to generate a positive crossover and RSI at 49 denotes neutral sentiment between bullish and bearish positions However, if prices break down the rising trendline support at $138.00 then it will trigger a negative sentiment and bear’s can drag the prices towards the $128.00 level.
Summary
The Walmart stock prices are consolidating in the narrow range and are likely to decide the further direction after the Q4 earnings. The technical analysis suggests that prices are into the bulls grip till the $138.00 support level is sustained. However, the probability of the upward breakout is also low until the WMT beats the street Q4 expectation.
Technical levels
Resistance levels : $153.00 and $164.00
Support levels : $138.00 and $128.00
Disclaimer
The views and opinions stated by the author, or any people named in this article, are for informational ideas only, and they do not establish financial, investment, or other advice. Investing in or trading crypto assets comes with a risk of financial loss.

Andrew is a blockchain developer who developed his interest in cryptocurrencies while pursuing his post-graduation major in blockchain development. He is a keen observer of details and shares his passion for writing, along with coding. His backend knowledge about blockchain helps him give a unique perspective to his writing skills, and a reliable craft at explaining the concepts such as blockchain programming, languages and token minting. He also frequently shares technical details and performance indicators of ICOs and IDOs.


