
 Home
Home News
News

- Litecoin was currently at $92.86 with a decrease of 2.25% during the intraday trading session.
- The pair of LTC/BTC was around 0.004006 BTC with a decrease of 1.01%.
- The current price of Ravencoin is above 20, 50, 100 and 200 days EMA.
Litecoin is a cryptocurrency founded in 2011, two years after Bitcoin, by Charlie Lee, a former Google engineer. It has features similar to Bitcoin but a different algorithm. The goal of cryptocurrency is to become a medium for daily transactions. When compared to Bitcoin, Litecoin has a faster transaction processing time. Litecoin uses a hashing algorithm called Scrypt. Scrypt is more memory-intensive and slower than SHA-256. But it found greater acceptance in the cryptocurrency community after the 2011 Tenebrix project modified Scrypt to work with regular CPUs for mining. One of Litecoin’s original missions was to discourage enterprise-sized miners from gaining control of the mining process by using a different encryption method. However, miners quickly adapted their specialized machines and continued to grow their mining capacity.

The current price of the Litecoin was around $92.86 with a decrease of 2.25% during the intraday trading session. The pair of LTC/BTC was around 0.004006 BTC. The LTC is approaching the major resistance of $117.0327 and if the investors stay active the price of the coin may break the major resistance after a long consolidating phase which was going on for 9 months, starting from may of 2022.

If the sellers push themselves then the coin may drop to the demand zone. This may lead the LTC to drop the coin to the primary support of $58.931 and if the seller’s dominance over the LTC’s market increases then the price may reach the secondary support of $48.601. The movement of the Bears may bring LTC to a crucial stage.
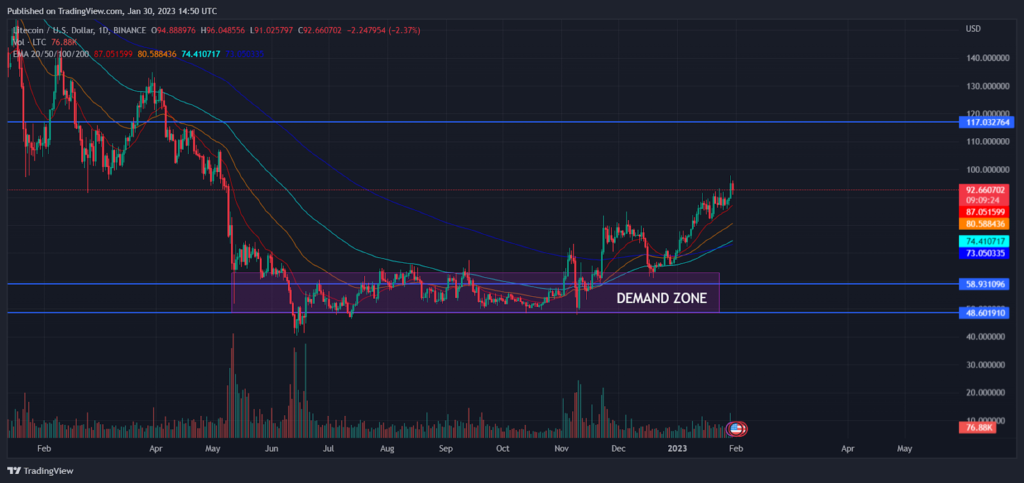
The volume of the coin has decreased by 9.92% in the last 24 hours. The decreasing volume indicates that the sellers has increased which may bring a fall of LTC to the demand zone. The coin’s price is heading above 20, 50, 100 and 200-days Daily Moving Average.
The Technical Analysis of Litecoin:
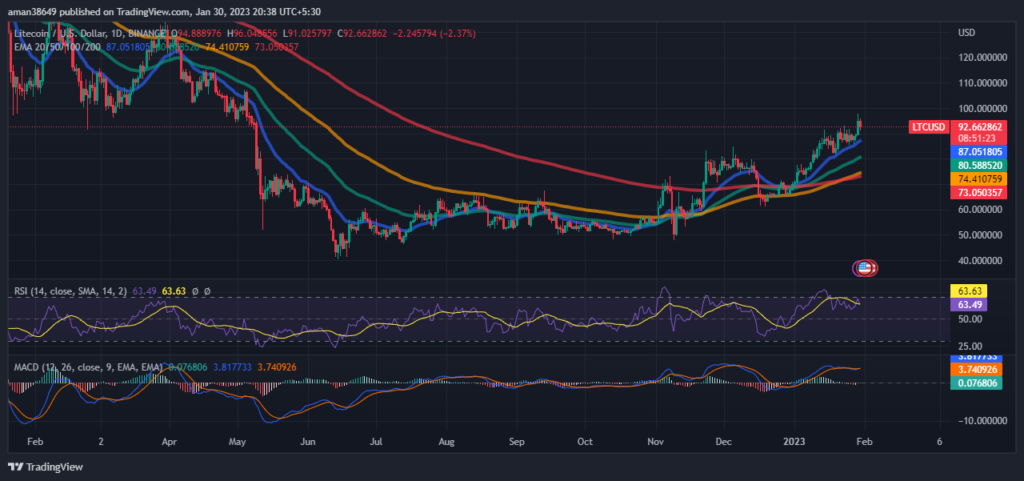
The technical indicators shows that RSI of the LTC is showing the signs of exiting the extreme overbought zone which indicates that sellers are coming in majority and trying to acquire the market. The current RSI is around 63.17 which is below the average RSI of 63.60.
The MACD and MACD signal are intersecting but not giving a definitive crossover. Investors are eagerly waiting for any movement over the daily price chart.
Conclusion
Litecoin was created in 2011 by Charlie Lee, a former Google programmer, two years after Bitcoin. It differs in algorithm yet has features that are similar to those of Bitcoin. The price of Litecoin went down 2.25% during the intraday trading session, or about $92.86 at the moment. The LTC/BTC exchange rate was roughly 0.004006 BTC. The coin may drop to the demand zone if the sellers push themselves. In the past 24 hours, the coin’s volume has declined by 9.92%. The LTC’s RSI is exhibiting symptoms of leaving the extremely overbought zone, according to technical indicators.
Technical Levels
Support Levels:
Resistance Levels:
Disclaimer
The views and opinions stated by the author, or any people named in this article, are for informational ideas only, and they do not establish financial, investment, or other advice. Investing in or trading crypto assets comes with a risk of financial loss.

Andrew is a blockchain developer who developed his interest in cryptocurrencies while pursuing his post-graduation major in blockchain development. He is a keen observer of details and shares his passion for writing, along with coding. His backend knowledge about blockchain helps him give a unique perspective to his writing skills, and a reliable craft at explaining the concepts such as blockchain programming, languages and token minting. He also frequently shares technical details and performance indicators of ICOs and IDOs.


