
 Home
Home News
News

- Loopring token price is on continuous rise and forming higher high candles
- LRC token price is sustained above the 50 day EMA and attempting to breakout of the 200 day EMA
- LRC token technical indicators turning bullish and price action seems to be also favoring the bulls
Loopring Token price is trading with bullish cues and bulls are trying to break out of the 200 day EMA but confirmation is still awaited. However, the probability of upside breakout is high if prices hold the $0.3000 level on a closing basis. Currently, The pair of LRC/USDT is trading at $0.3444 with an intraday gains of 7.16% and the 24-hour volume to market cap ratio at 0.2504

What’s cooking inside the LRC token price ?
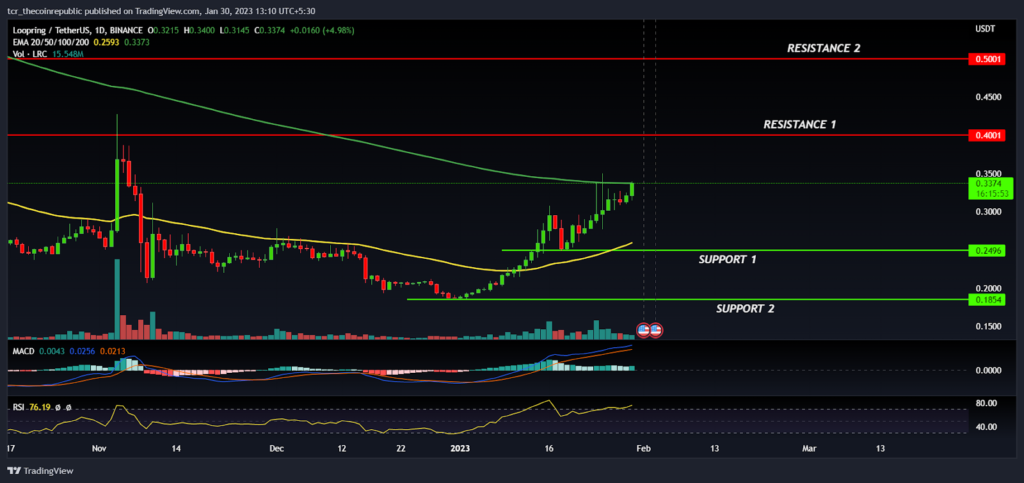
On a daily time frame, Loopring token prices had shown a meaningful recovery and prices are continuing the upward momentum by forming higher high candles.LRC token has already reclaimed 50 day EMA which has reversed the short term trend in the favor of bulls and now the prices attempting to breakout of the 200 day EMA which will turn the positional trend in the favor bulls.

LRC token prices had taken a minor retracement and re-tested the breakout level at $0.2496 but surprisingly it showed a sharp recovery which has triggered the positive sentiment and bulls continued the upward momentum. However, the prices are racing towards the $0.4000 level which will act as an immediate resistance in the coming days and if bulls succeed to break out of the hurdle level then it can rally towards the $0.5000 level in a short span of time.
LRC token technical indicators are turning bullish and the price action is also favoring the bulls which shows the confidence of bulls at the lower levels. The MACD had generated a positive crossover indicating prices are likely to trade with the bullish bias whereas the RSI curve at 77 near to the overbought level. On the other hand, If prices faced rejection from the 200 day EMA then $0.2496 will be acting as a savior for the bulls.
Summary
Loopring token prices had shown a V-shape recovery from the lows and bulls are trying to hold the price above the 200 day EMA but the confirmation is still awaited. Technical analysis suggests that prices are into the bulls grip and any dips near to the support zone will be a buying opportunity for the short term traders.
Therefore, traders may look for buying near to 50 day EMA retracement for the better risk reward and aim for the target of $0.5000 and above by keeping $0.2000 as SL. However, if prices drop below $0.2000 then LRC might march towards new lows.
Technical levels
Resistance levels : $0.4000 and $0.5000
Support levels : $0.2496 and $0.1854
Disclaimer
The views and opinions stated by the author, or any people named in this article, are for informational purposes only, and they do not establish financial, investment, or other advice. Investing in or trading crypto assets comes with a risk of financial loss.

Andrew is a blockchain developer who developed his interest in cryptocurrencies while pursuing his post-graduation major in blockchain development. He is a keen observer of details and shares his passion for writing, along with coding. His backend knowledge about blockchain helps him give a unique perspective to his writing skills, and a reliable craft at explaining the concepts such as blockchain programming, languages and token minting. He also frequently shares technical details and performance indicators of ICOs and IDOs.


