
 Home
Home News
News

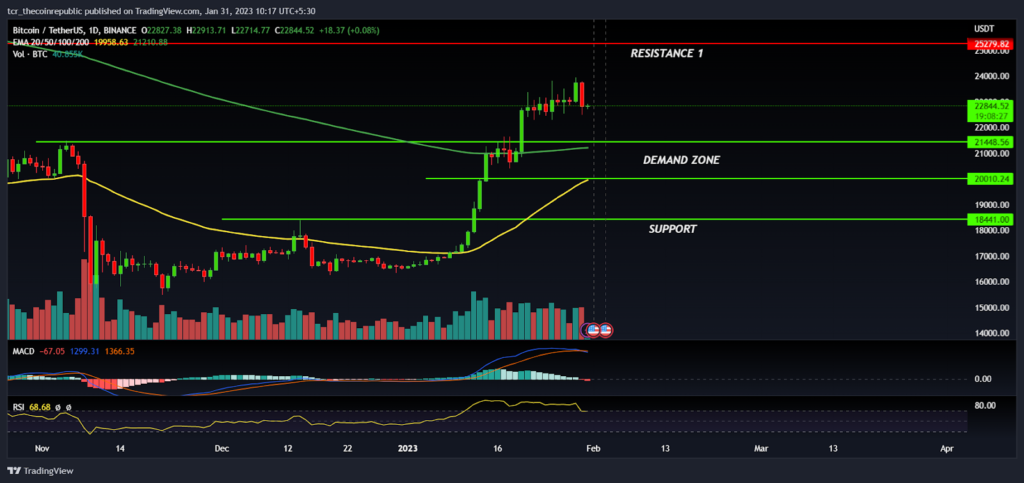
- BTC price formed a rejection candle from the supply zone at $24,000
- Bitcoin price sustained above the 50 and 200-day EMA
- Technical indicators of the BTC reversing down from the overbought zone
Bitcoin price is trading with mild bearish cues and bears are trying to keep the price below the $23,000 level. BTC price formed a rejection candle in the previous session which seems to be reliable and the price might witness a short-term correction in the coming days. At the time of writing, The pair of BTC/USDT was trading at $22,770 with an intraday loss of 0.24% and the 24-hour volume-to-market cap ratio at 0.061

BTC price prepares for short-term correction?
On a daily time frame, Bitcoin price had shown a massive up move from the lower levels and has reclaimed both the 50 and 200-day EMA which have derived the positive sentiment in the overall crypto market.

In the mid of January, BTC price took a halt at the $21,500 hurdle level, and bears tried to drag it down but surprisingly after a little bit of consolidation bulls were able to break out of the $21,500 hurdle level with a giant bullish candle indicates that some genuine buyers have taken long positions and $20,000 to $21,000 will be a new demand zone for the coming months.
BTC price had broken out of the 200-day EMA and holding the price above it, indicates that the positional trend has reversed in the favor of bulls and any dips towards the demand zone will provide an opportunity to accumulate at lower levels. However, the fact is BTC price had shot up 40% in the short span of time, it’s obvious that price need correction or consolidation for continuing the upward momentum. On the higher side $24,000 will act as an immediate resistance for the bulls followed by the next hurdle at $25,279
BTC technical indicators are reversing down which shows that the price is lacking momentum from the higher levels and may retest the demand zone in the coming weeks. The MACD curve is on the way to generate a negative crossover and the RSI curve crashes down from the overbought levels.
Summary
BTC price faced rejection from the supply zone and bears are trying to drag it down from the higher levels. However, the trend is in the favor of bulls and any dips will provide buying opportunities for the investors. The technical analysis suggests that BTC price is overextended and likely to retest the demand zone mentioned in the chart.
Therefore, Traders should wait for price to retest the demand zone for building long positions. However, if the price climbs above the $24,000 hurdle then it can rally toward $25,000 in a short span of time.
Technical levels
Resistance levels: $24,000 and $25,279
Support levels: $21,448 and $20,000
Disclaimer
The views and opinions stated by the author, or any people named in this article, are for informational purposes only, and they do not establish financial, investment, or other advice. Investing in or trading crypto assets comes with a risk of financial loss.

Nancy J. Allen is a crypto enthusiast, with a major in macroeconomics and minor in business statistics. She believes that cryptocurrencies inspire people to be their own banks, and step aside from traditional monetary exchange systems. She is also intrigued by blockchain technology and its functioning. She frequently researches, and posts content on the top altcoins, their theoretical working principles and technical price predictions.


