
 Home
Home News
News

- AAVE token price sustained above 200 day EMA and prepares for the golden crossover
- AAVE price formed doji candle on the weekly basis
- AAVE token technical indicators are reversing down
AAVE price is trading with mild bearish cues but the bulls seem to be aggressive and trying to hold the prices above the 200 day EMA. According to Coinglass, In the last 12 hours AAVE Long and Short ratio stands at 0.81 which also denotes mild bearishness but the price action is in favor of bulls. Currently, The pair of AAVE/USDT is trading at $85.4 with an intraday loss of 0.35%

Will the AAVE price be able to break $100 ?
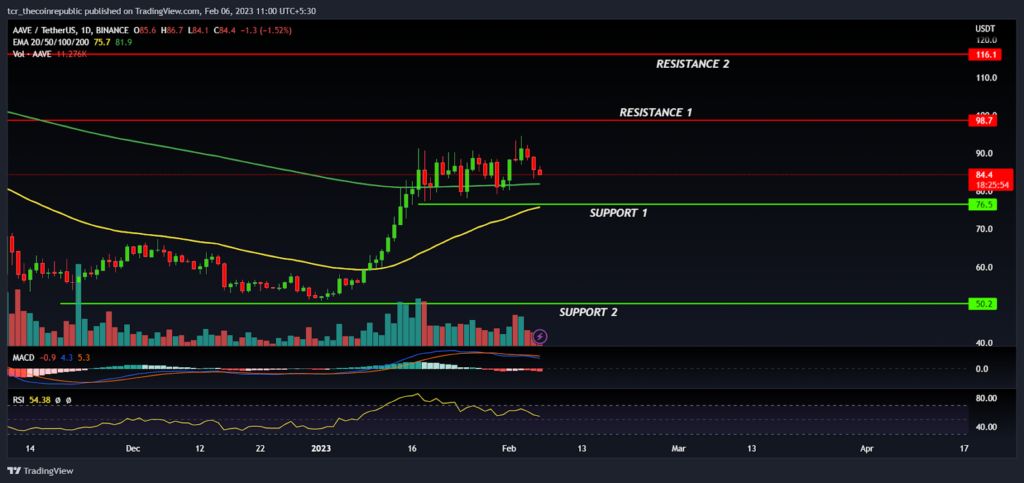
On a daily time frame, AAVE price is forming a bullish continuation and bulls are trying to hold the price above the 200 day EMA(green) which shows that the positional trend has reversed in the favor of bulls. In the mid January, AAVE token price gained some upward momentum and succeeded to reclaim the 50 day EMA (yellow) which has derived the positive sentiment and prices shot up 50% approx in a short span of time.

AAVE price took halt at $94.00 and forming a rejection candle indicates that the bear’s are active at higher levels and it will be not easy for the bulls to break out of the $94.00 hurdle level. However, if the price holds the 200 day EMA then it will increase the probability of breakout in the favor of bulls. On the higher side, if bulls succeed to break out of the $94.00 level then the next hurdle will be at $98.00
The technical indicators of the AAVE token is reversing down and indicating mild bearishness but the price action is still in the favor of bulls. The MACD has generated a negative crossover that shows that the price may trade with the bearish bias for the short period of time whereas the RSI at 55 near to the neutral level denotes the balance between bullish and bearish sentiments.On the lower side, $76.00 is acting as immediate support for the bulls and if AAVE price drop below $76.00 then it will be matter of concern for the bullish traders.
Summary
AAVE token price is stuck in the narrow range and likely to see a positive breakout if prices are able to hold the 200 day EMA in the coming months. The technical analysis suggests that the prices are in the bulls grip and minor corrections will provide buying opportunities for the short term traders.
Therefore, traders may look for buying near to the 50 day EMA retracement for the target of $100.00 by keeping $76.00 as SL. However, if the price drops below $76.00 then bear’s can drag it down towards $65.00 level.
Technical levels
Resistance levels : $98.00 and $116.00
Support levels : $76.00 and $66.00
Disclaimer
The views and opinions stated by the author, or any people named in this article, are for informational purposes only, and they do not establish financial, investment, or other advice. Investing in or trading crypto assets comes with a risk of financial loss.
Steve Anderson is an Australian crypto enthusiast. He is a specialist in management and trading for over 5 years. Steve has worked as a crypto trader, he loves learning about decentralisation, understanding the true potential of the blockchain.


