
 Home
Home News
News

- Token fails to break above the supply zone on the daily time frame.
- The pair of HBAR/USDT is trading at the price level of $0.0691 with a decrease of -0.72% in the past 24 hours.
With strong bullish momentum, the Hedera (HBAR) token has gained more than 90% in the past few weeks. Through proof-of-stake, HBAR tokens are utilized to pay application transaction fees and safeguard the network against assault. Fuel for the network.

HBAR token on the daily chart
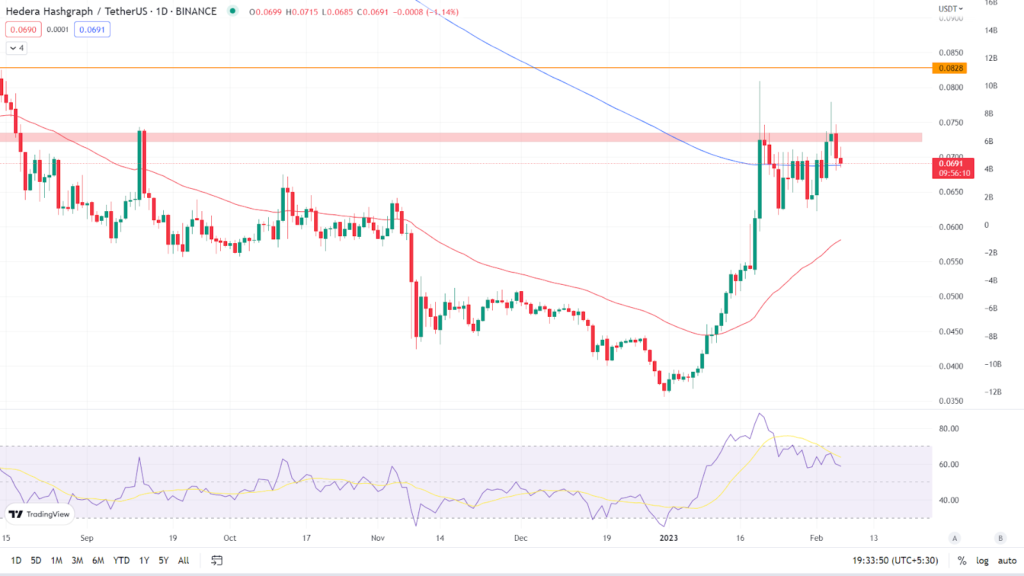
We can see the token has formed a double top pattern near the supply zone and the token is facing rejection on the daily time frame. According to the daily chart, the HBAR token is currently trading at $0.0691, indicating a loss of -0.72% in the last 24 hours. The token is trading above its key Moving Averages of 50 and 200. (Red line is 50 EMA and the blue line is 200 EMA). It remains to be seen whether the bulls can prevent the bears from driving down the token price.

Relative Strength Index: The RSI curve of the asset is currently trading at 59.40 and is decreasing in value as the token is rejected from the supply zone. The RSI curve has crossed below the 14 SMA, indicating bearishness. If the token continues to fall and breaks below the 200 EMA on the daily time frame then the value of the RSI curve will drop even further.
Analyst view & Expectations
The token gained strong bullish momentum but was unable to break above the supply zone and continue the bullish momentum. Investors should hold their buys and wait for the token to break above the supply zone for more confirmation on the trend’s direction. Intraday traders, on the other hand, have a good opportunity to go short if the token falls below the 200 EMA and book profit based on their risk to reward ratio.
According to our current Hedera Hashgraph (HBAR) price prediction, the value of Hedera Hashgraph (HBAR) is expected to climb by 21.07% in the next few days, reaching $ 0.084242. Our technical indicators indicate that the current sentiment is Neutral, with the Fear & Greed Index reading 56. (Greed). Over the previous 30 days, Hedera Hashgraph had 19/30 (63%) green days and 17.89% price volatility. Based on our Hedera Hashgraph forecast, it’s not a good time to buy Hedera Hashgraph.
Technical Levels
Major support: $0.0624
Major resistance: $0.0735 & $0.0828
Conclusion
The token has not been able to provide breakout above the supply zone on the daily time frame and bears are pushing down the token price forming a bearish chart pattern. Before acting, investors should wait for a clear indication.
Disclaimer: The views and opinions stated by the author, or any people named in this article, are for informational ideas only, and they do not establish the financial, investment, or other advice. Investing in or trading crypto assets comes with a risk of financial loss.

With a background in journalism, Ritika Sharma has worked with many reputed media firms focusing on general news such as politics and crime. She joined The Coin Republic as a reporter for crypto, and found a great passion for cryptocurrency, Web3, NFTs and other digital assets. She spends a lot of time researching and delving deeper into these concepts around the clock, and is a strong advocate for women in STEM.


