
 Home
Home News
News

- MANA showed a great bull move last month after being in a downtrend for the past many months.
- MACD and RSI indicators are not giving any buy signals at the current moment.
- A Golden Crossover can be seen on the daily chart of the token sooner.
MANA price is moving in a sideways trend. The MANA price is currently at its resistance level after previously displaying a strong bull move from its support level.

The bulls are making a lot of effort to surpass these levels, but they are unable to accomplish so. Every time the price crosses these levels, it moves on to a nearby resistance level and then drops down again. Additionally, we can observe that 50 EMA and 200 EMA are coming close to each other, thereby increasing the chances of a Golden Crossover.

Monoscopic View
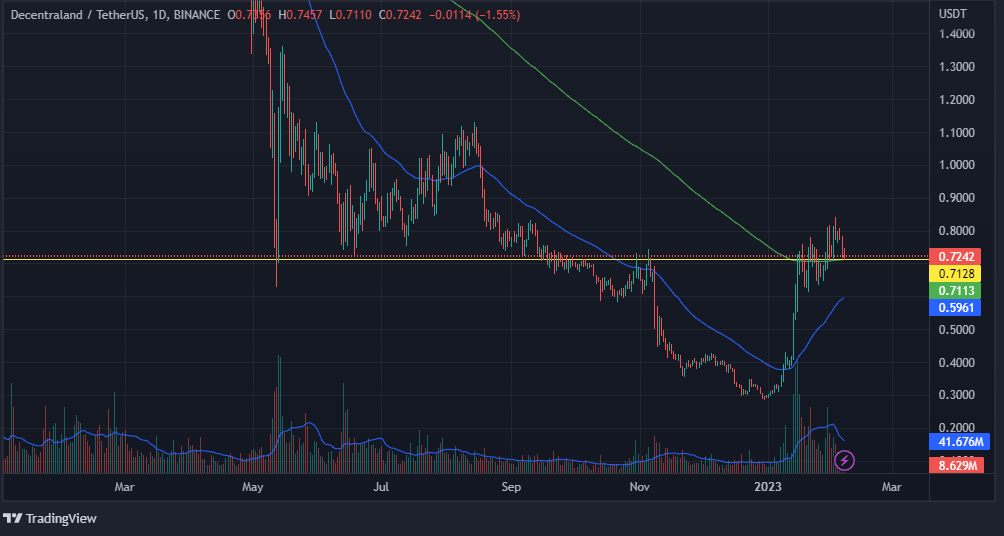
MANA had been in a downtrend for a number of months, but during the previous month, the price displayed a fantastic bull rally from its support level. As for right now, we can see that bulls are facing tough competition from bears at the resistance level and as a result, the price has gone into a consolidation zone. Therefore, we could anticipate the token to continue its bull rise if the price breaks through this consolidation zone.
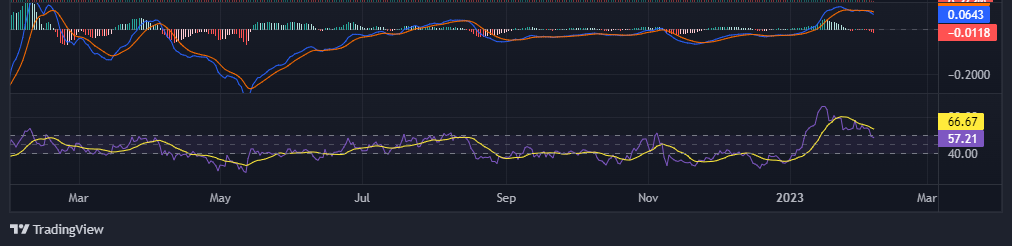
The MACD indicator has shown a bearish crossover which means that bears are stronger than bulls at the current time and the price can decline. On the other hand, though the RSI is trading at 57.28 which is above its 50-point level but as the curve is falling so there are chances that the price may fall. Overall, both the indicators MACD and RSI do not give any buy signal.
Microscopic View
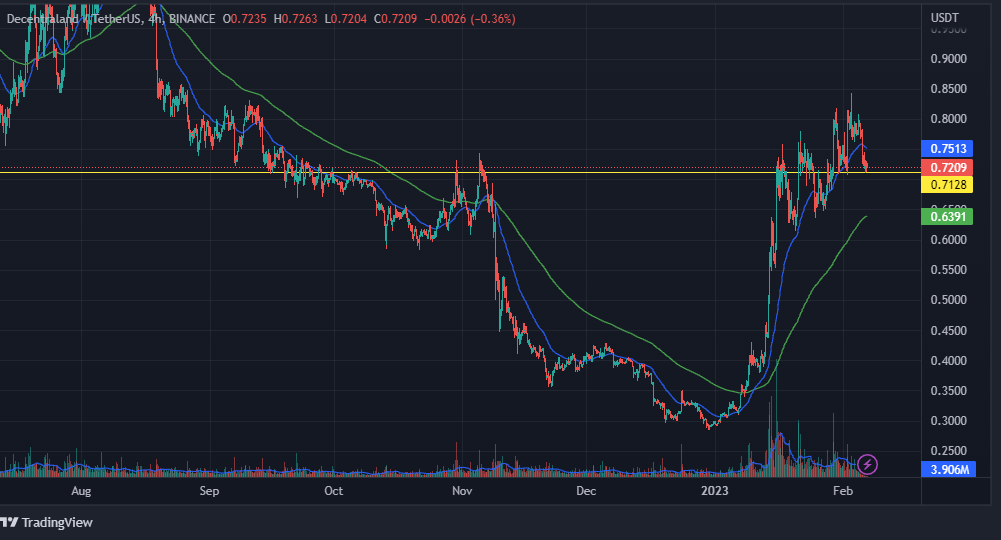
On the short-term chart, the levels which are acting as resistance on the daily chart are acting as support. In the shorter time frame as well, we can see tough competition between bulls and bears. The price is trading in a particular zone at the moment. Any breakout or breakdown of the zone can move the price in either direction i.e. upward or downward.
By February 11, 2023, the price of Decentraland (MANA) is expected to increase by 15.38% and reach $0.832338, according to Coin Codex’s most recent price prediction. Its technical indicators indicate that the current sentiment is bearish and the Fear and Greed Index is currently at 56 (Greed).
Conclusion
The token can give a strong bull move if it breaks its consolidation zone that is formed on the daily chart.
Technical Levels
Resistance levels – $0.8146 and $1.0361
Support levels – $0.3671 and $0.2874
Disclaimer: The opinions represented in this work along with any other opinions are presented primarily for informative purposes and are not intended to be taken as investment advice.

Nancy J. Allen is a crypto enthusiast, with a major in macroeconomics and minor in business statistics. She believes that cryptocurrencies inspire people to be their own banks, and step aside from traditional monetary exchange systems. She is also intrigued by blockchain technology and its functioning. She frequently researches, and posts content on the top altcoins, their theoretical working principles and technical price predictions.


