
 Home
Home News
News

- EOS token price has been on an uptrend as the token price bounced off the demand zone.
- EOS token price is trading near the supply zone and as of now, it has started consolidating near it.
- The pair of EOS/BTC trading at the price of 0.00004607 with an increase of 1.69% in the last 24 hours.
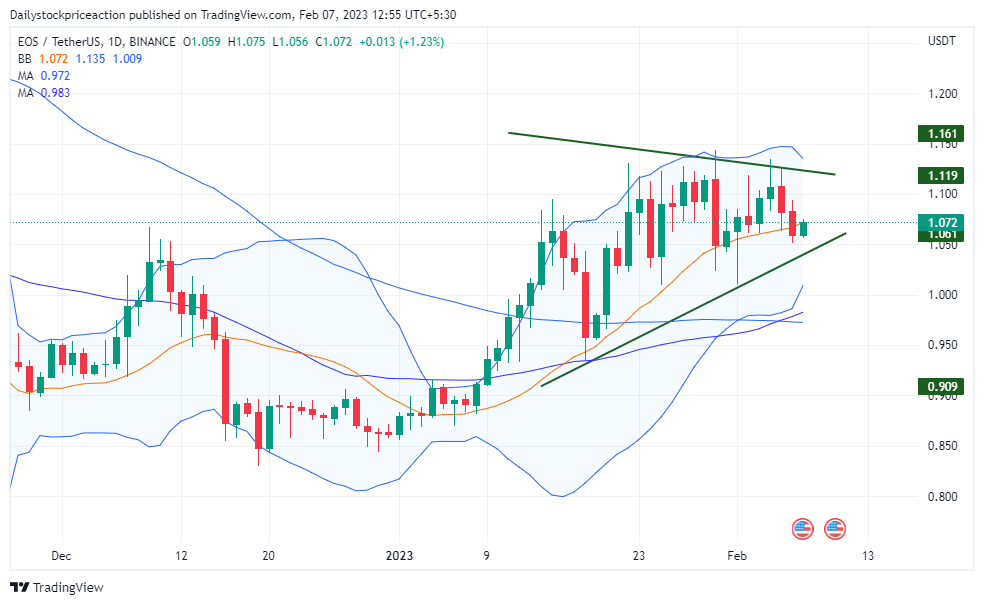
In the previous 24 hours, the EOS token price has rebounded off the demand zone while in an uptrend. The price of tokens is still circling the available supply. On a daily time scale, however, it has developed a bearish rejection candlestick pattern. On a daily basis, it has developed a pattern with a rounded bottom.

On a daily time scale, the price of the EOS token is generating higher high and higher low formations. The token price is currently trading in the supply zone after breaking through every single short-term resistance. After rebounding from the lower band of the Bollinger band indicator, the price of the EOS token is currently trading at the upper band of the indicator. In the daily time frame, the price of the EOS token has broken out above its 14 SMA and 50 MA. It is resting at these Moving averages at the moment.

Despite recent consolidation, the token price has crossed above the 100 Moving Average. As a result, the token price may experience upward support before experiencing a sharp decline. Despite the bullish move of the previous day, volumes have dropped. Investors should therefore exercise caution and wait for a distinct trend.
The EOS token price is forming a symmetrical triangle pattern on the daily time frame
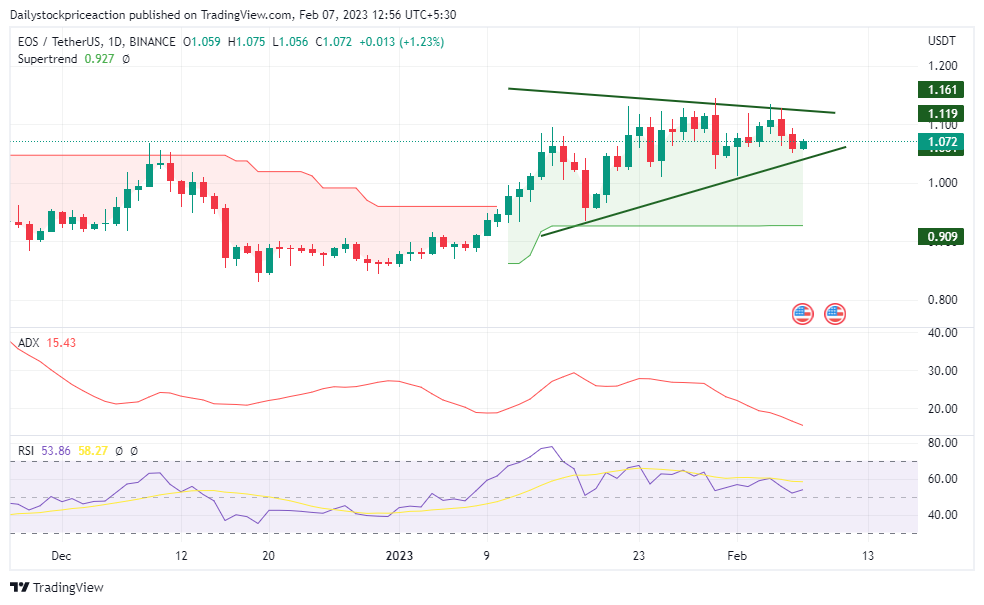
Average Directional Movement Index: As the token price keeps rising gradually, the ADX curve has been rising on a higher time frame. The ADX curve has risen out of the 35 level and turned upwards on a daily time frame. As of a 4-hour time period, the token price is at the short-term demand zone. It is encouraging for the price of the token. Investors want to hold off until a bullish candle formation forms in the demand zone.
Relative Strength Index: The RSI curve is currently trading at 58.75. The RSI curve is yet to move past the 60-percent threshold. The RSI curve will begin to move upward after the token breaks out of a symmetrical triangle pattern on a daily time frame. The yellow 14 EMA line has been crossed by the RSI curve, signalling a short-term bullishness.
Supertrend: Supertrend indicator is positive as the token price broke the important small-term supply zone on the daily timeframe. Since then the token price has failed to give a breakout of the supply zone in a larger time frame. As of now, the token price has broken the supertrend sell line which has triggered a buy line.
Conclusion: EOS token price has been hovering around the supply zone. The technical parameters suggest a bullish move in the upcoming days. The price action is also suggesting the same. It remains to see if the token price will break the symmetrical triangle pattern or fall heavily.
Support: $1.05 and $0.980
Resistance: $1.13 and $1.16
Disclaimer
The views and opinions stated by the author, or any people named in this article, are for informational ideas only and do not establish financial, investment, or other advice. Investing in or trading crypto assets comes with a risk of financial loss.

With a background in journalism, Ritika Sharma has worked with many reputed media firms focusing on general news such as politics and crime. She joined The Coin Republic as a reporter for crypto, and found a great passion for cryptocurrency, Web3, NFTs and other digital assets. She spends a lot of time researching and delving deeper into these concepts around the clock, and is a strong advocate for women in STEM.


