
 Home
Home News
News

- LTC coin price is trading below the long-term supply LTC of $106.70, as the coin continues the bullish rally.
- The LTC coin price is from a rounding bottom pattern on a daily time frame.
- The pair of LTC/BTC is trading at the price level of 0.004324 with an increase of 0.96% in the last 24 hours.
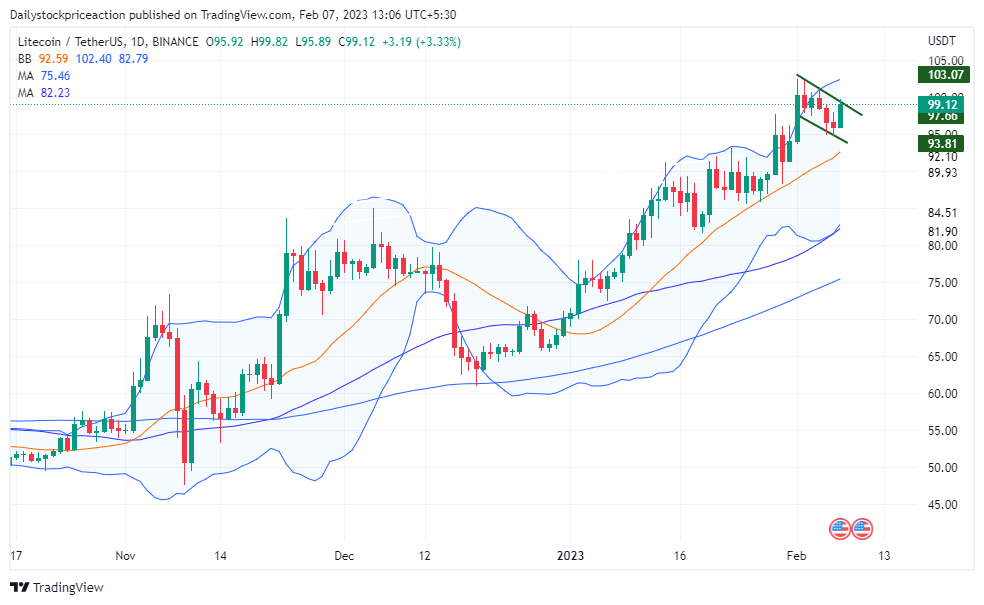
The LTC coin price is currently trading close to the supply LTC after bouncing off the demand LTC, according to price activity. Daily, the price of LTC coins has formed a rounding bottom pattern, with higher high and higher low formations.

LTC coin prices are currently fluctuating within a narrow range. When the LTC coin price consolidates, it will be interesting to see if it breaks out to the upside or not. LTC coins are currently trading below every significant Moving Average. The coin price is trading near the 50 Moving Average. Recently, the coin price attempted but failed to break out of the 50 Moving Average.

After rebounding from the lower band, the price of the LTC coin has been trading at the upper band of the Bollinger band indicator. The price of the LTC coin has already surpassed the 14 SMA. The coin price must surpass the supply LTC of $0.0290 to continue moving higher. Throughout the most recent trading days, volumes have climbed.
LTC coin price has formed a flag and pole pattern
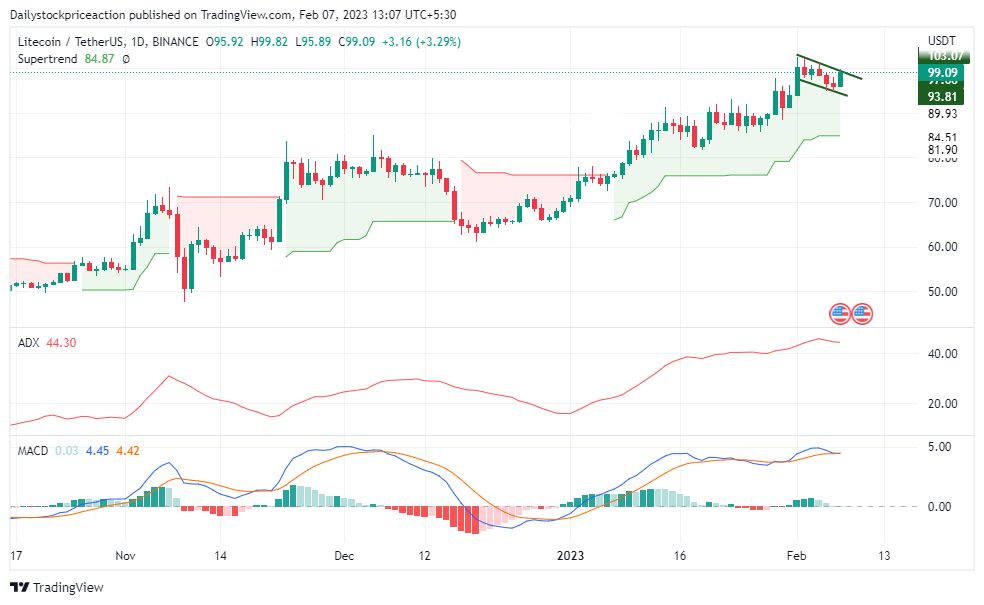
Supertrend: LTC coin price has risen to the long-term demand zone of $86.66 during the last 3-month bullish momentum in the overall cryptocurrency market. The super trend gave a buy signal as it broke down the important supply zone of $86.66. Since then the coin price has been on a rise. It has failed to recover from the demand zone fully. Although the coin price has started consolidating, it remains to see if the coin price bounces off or falls further.
Moving Average Convergence Divergence: MACD indicators have had a positive crossover recently as the coin has started consolidating at the demand LTC. MACD indicators were positive as the coin price gave a positive crossover during the last breakout of the important supply zone at $0.10. As the coin starts bouncing off the demand LTC, the gap between the MACD lines could be seen widening supporting the trend.
Average Directional Movement Index: ADX has been dipping from the last trading hours as the coin fell below the important supply LTC. As of now, the coin has started rising slowly which has resulted in the ADX curve turning upwards.
The ADX curve has dipped out of the 45 mark and now if the coin price breaks the bullish flag and pole pattern, the ADX curve can be seen falling supporting the trend.
Conclusion: The LTC coin price has fallen to the long-term demand for LTC. As the technical parameters suggest, the coin price is in a neutral trajectory. It remains to see if the LTC coin price bounces off the demand LTC or falls below.
Support: $86 and $88
Resistance: $103 and $106
Disclaimer
The views and opinions stated by the author, or any people named in this article, are for informational ideas only, and they do not establish financial, investment, or other advice. Investing in or trading crypto assets comes with a risk of financial loss.

Andrew is a blockchain developer who developed his interest in cryptocurrencies while pursuing his post-graduation major in blockchain development. He is a keen observer of details and shares his passion for writing, along with coding. His backend knowledge about blockchain helps him give a unique perspective to his writing skills, and a reliable craft at explaining the concepts such as blockchain programming, languages and token minting. He also frequently shares technical details and performance indicators of ICOs and IDOs.


