
 Home
Home News
News

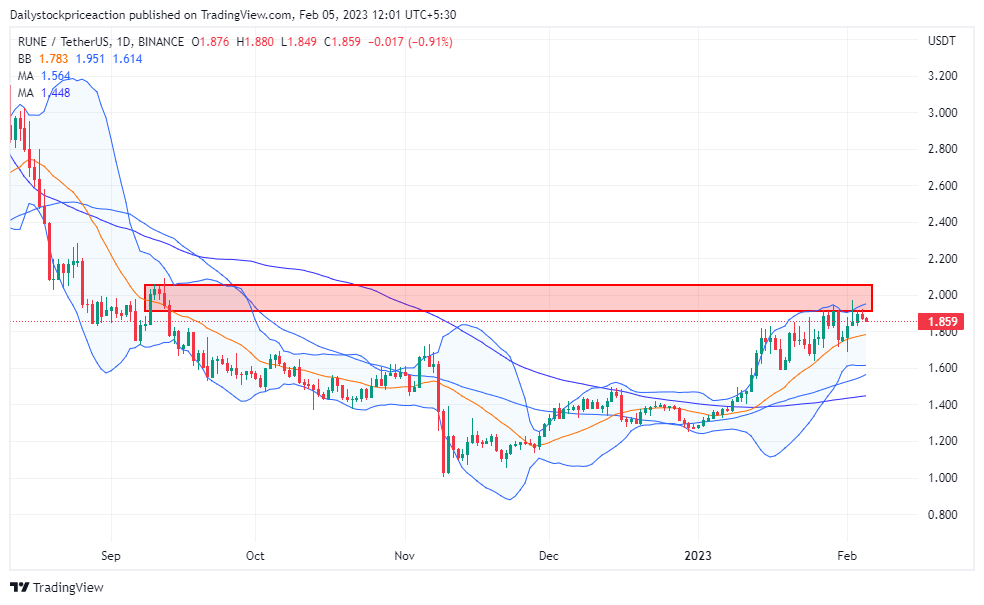
- The RUNE token price is trading at the long-term supply zone after bouncing off strongly from the demand zone on a daily time scale.
- The token price is forming a rounding bottom pattern on a daily time frame.
- The pair of RUNE/BTC is trading at the price level of 0.0000797 with a decrease of -1.26% in the past 24 hours.
The RUNE token price is on an uptrend for the last couple of weeks. The token price managed to stay at the long-term supply zone, and as a result, it started consolidating showing signs of a further up move. The token price is forming a higher high and higher low formation on a 4-hour time frame.

Rune token price is currently trading above the important moving averages. This came after the token price managed to stay above the demand zone which resulted in the breaking of the 50 and 100 MAs. Moving upwards this MAs can act as a strong demand zone during the pullback in the bullish rally. If the token price manages to do so, it can be seen breaking the long-term supply zone with a strong bullish candlestick pattern which will trigger a massive move.

At present, the RUNE token price is trading at the upper band of the Bollinger band indicator. Following the bullish rally in the overall cryptocurrency market, the current trend was seen in the rune token price. Volumes have increased as the token price showed a bullish movement.
The RUNE token price is forming a rounding bottom pattern on a daily time frame
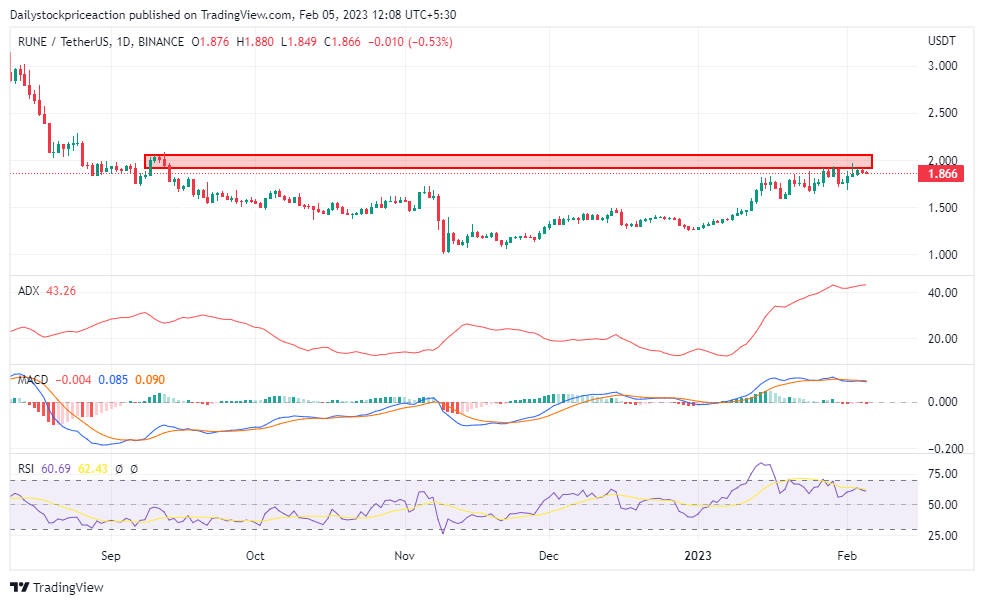
Moving Average Convergence Divergence: The AVAX token price is trading at the supply zone after rising from the demand zone. The recent rise in the price of the AVAX token price triggered a positive crossover on the MACD indicator. The blue line crossed the orange line on the upside. If the token price can sustain at the supply zone and storms off it breaking the rounding bottom pattern, the MACD lines can be seen widening supporting the trend. Investors should wait and watch for a proper signal of the trend as a breakdown of the current long-term demand zone will trigger. A negative crossover.
Relative Strength Index: RSI curve is trading at the level of 56.33. The RSI curve has crossed the halfway mark of 50. Once the token crosses the supply zone of 2.0 the token price can be seen moving up with strong bullish momentum. The RSI curve has crossed the 14 EMA yellow line indicating a short-term bullishness. Once the RSI crosses the mark of 60 the AVAX token price can be seen breaking the supply zone, supporting the trend.
Average Directional Movement Index: ADX has been continuously rising as the token price broke an important supply zone of $1.70. As of now, the token price is trading above this important demand zone. The breakout zone is now acting as a strong demand zone. At present, the coin price is trading at $1.866. The ADX curve has dipped out of the 35 mark.
Conclusion: As the price action suggests, there is a possibility of the token price breaking the long-term supply zone. As per the technical parameters, the trend seems to be bullish for the upcoming trading days. It remains to see if the token price will break the supply don’t, where bulls will overpower bears, or the opposite will happen.
Support: $1.5 and $1.7
Resistance: $2.1 and $2.5
Disclaimer
The views and opinions stated by the author, or any people named in this article, are for informational purposes only, and they do not establish financial, investment, or other advice. Investing in or trading crypto assets comes with a risk of financial loss.

Andrew is a blockchain developer who developed his interest in cryptocurrencies while pursuing his post-graduation major in blockchain development. He is a keen observer of details and shares his passion for writing, along with coding. His backend knowledge about blockchain helps him give a unique perspective to his writing skills, and a reliable craft at explaining the concepts such as blockchain programming, languages and token minting. He also frequently shares technical details and performance indicators of ICOs and IDOs.


