
 Home
Home News
News

- GRT token price broke out of the 200 day EMA and formed a giant bullish candle
- The Graph price turned highly bullish and showing signs of positional trend reversal
- Technical indicators of GRT token turned bullish but the RSI entered into overbought zone
The Graph (GRT) token price is trading with bearish cues but after seeing the yesterday up-move it will be risky to create short positions on the higher levels. According to coinglass, In the last 12 hours, the Long and short ratio stand at 0.99 which denotes the balance between long and short positions. Currently, The pair of GRT/USDT is trading at $0.1908 with an intraday loss of 8.49% and the 24-hour volume to market cap ratio at 0.7413

Will GRT price enter consolidation or more upside possible ?
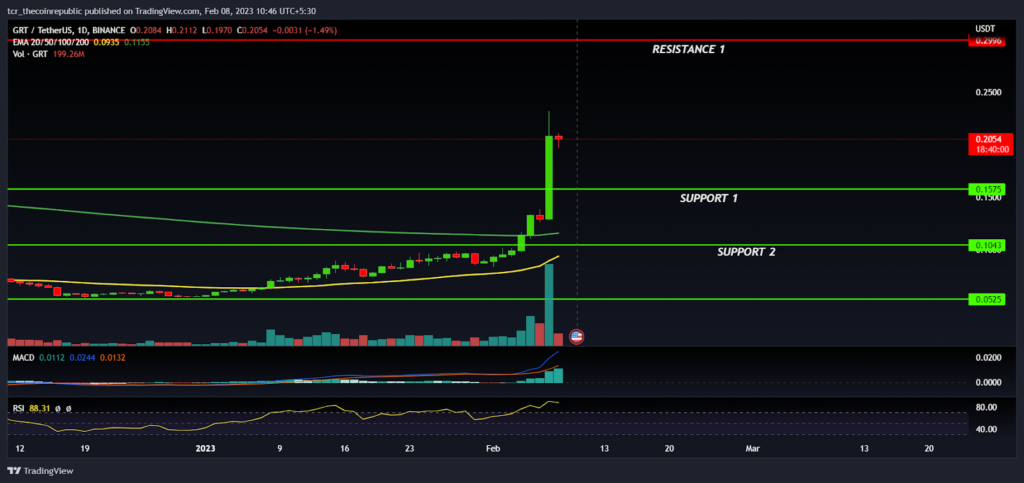
On a daily time frame, GRT token price has shown a surprising up-move of 60% on the intraday basis and succeeded to break out of the swing high hurdle level with the giant bullish candle which increases the sustainability of the breakout and shows the confidence of the bulls in the lower levels.

In the beginning of february, GRT token price took support at 50 day EMA and gained some positive momentum which helped the bulls to reclaim above the 200 day EMA and turned the positional trend in the favor bulls. However, the prices are over extended and likely to see some retracement or consolidation before deciding the further direction. On the other hand, if the price breaks the previous day high at $0.2322 and it can rally toward the $0.2996 mark which will also act as a strong barrier for the bulls.
The technical indicator of the GRT token like MACD which has generated a positive crossover indicating bullishness and the price action is also favoring the direction of bulls but the RSI at 80 denote an overbought zone which might trigger a minor sell off from the higher level. On the lower side, $0.1575 will act as immediate support for the bulls and if prices retest the support level then it will provide an opportunity to accumulate at the favorable price.
Summary
The Graph (GRT) prices have shown a wild up-move and given a huge pain to the short sellers with a giant bullish candle which shows that the bulls are getting active returning back to the track. The technical analysis suggests that the price is in bulls grip and dips toward support levels will provide a buying opportunity for the traders as well as investors.
Therefore, traders may wait for minor retracement or consolidation for building up long positions for the target of $0.2996 by keeping $0.1043 as SL
Technical levels
Resistance levels : $0.2322 and $0.2996
Support levels : $0.1575 and $0.1043
Disclaimer
The views and opinions stated by the author, or any people named in this article, are for informational purposes only, and they do not establish financial, investment, or other advice. Investing in or trading crypto assets comes with a risk of financial loss.

Nancy J. Allen is a crypto enthusiast, with a major in macroeconomics and minor in business statistics. She believes that cryptocurrencies inspire people to be their own banks, and step aside from traditional monetary exchange systems. She is also intrigued by blockchain technology and its functioning. She frequently researches, and posts content on the top altcoins, their theoretical working principles and technical price predictions.


