
 Home
Home News
News

- The LRC token price is in a strong uptrend as it broke the small-term supply zone on a daily time frame.
- The LRC token price is forming a rounding bottom pattern on a daily time frame.
- The pair of LRC/BTC is trading at the price level of 0.000001912 with an increase of 6.98% in the past 24 hours.
The LRC token price, as per the price action, is in a strong uptrend as it broke the supply zone. As of now, it has started consolidating near the long-term supply zone. After showing a bullish rally off the demand zone, the LRC token price has now fallen after rising to the supply zone. As a result, the token price has formed a bullish rounding bottom pattern.

LRC token tackles the bearish pressure

The LRC token price has started forming higher high and higher low formations on a daily time frame. At present, the LRC token price is trading in the middle of the Bollinger band indicator after failing to surpass the upper band. The LRC token price has gone past the 20 EMA and therefore the LRC token price can take support moving upwards.

The LRC token price has also crossed the 50 and 25 Moving Averages. Going forward these MAs can act as a strong demand zone. Volumes have increased as the token price bounced off the demand zone strongly. Investors should wait for a breakout of the supply zone and then act accordingly.
The LRC token price is trading in a small range on a daily time frame
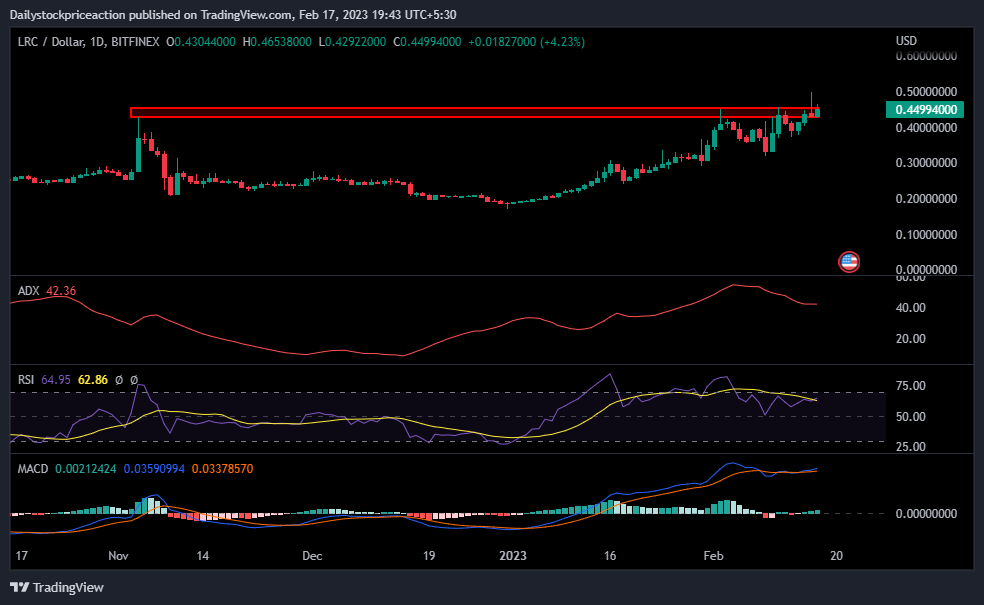
ADX curve has been rising on a higher time frame as the token continues to rise. It is a positive sign for the token price. In a daily time frame, the ADX curve has dipped out of the 20 mark and has turned upwards. As the token price rests at the short-term demand zone on a 4-hour time frame. Investors should wait for a positive candle formation at the demand zone.
RSI curve is trading at the level of 42.51. The RSI curve is yet to cross the halfway mark of 50. The LRC token price has given a breakout of a strong small-term supply zone on a daily time frame. Once the token price breaks the rounding bottoms pattern, the RSI curve can be seen moving up rapidly. The RSI curve has crossed the 14 EMA yellow line indicating a short-term bullishness. The breakout of the bullish chart pattern will result in the RSI curve crossing the halfway mark of 50, supporting the breakout.
MACD indicator has been positive as the token price hovers around the supply zone. The MACD indicator gave a positive crossover where the blue line crossed the orange line on the upside. Once the LRC token price crosses the rounding bottom of the chart pattern supply zone, the MACD lines can be widening supporting the trend.
Conclusion: The LRC token price is super bullish for the last couple of days and the same is seen on the chart. The price action and the technical parameters suggest the same. It remains to see if the token price will break the supply zone or face rejection and falls.
Support: $0.32 and $0.36
Resistance: $0.47 and $0.51
Disclaimer
The views and opinions stated by the author, or any people named in this article, are for informational purposes only, and they do not establish financial, investment, or other advice. Investing in or trading crypto assets comes with a risk of financial loss

Andrew is a blockchain developer who developed his interest in cryptocurrencies while pursuing his post-graduation major in blockchain development. He is a keen observer of details and shares his passion for writing, along with coding. His backend knowledge about blockchain helps him give a unique perspective to his writing skills, and a reliable craft at explaining the concepts such as blockchain programming, languages and token minting. He also frequently shares technical details and performance indicators of ICOs and IDOs.


