
 Home
Home News
News

- LRC price might be taking a correction before the bull run.
- After breaking out of the 200 EMA LRC price is making a continuous higher high higher low pattern
- Major EMA’s making a golden crossover
The current market sentiments of investors are currently in the neutral zone at 53 points while the public sentiments were trading in the greed zone previously according to alternative me.com a site that analyses emotions and sentiments from different sources. While recently after an extremely bullish move buyers now seem to be hesitating in supporting the price at current levels. The current LRC price is $0.39.

The LRC price taking a correction
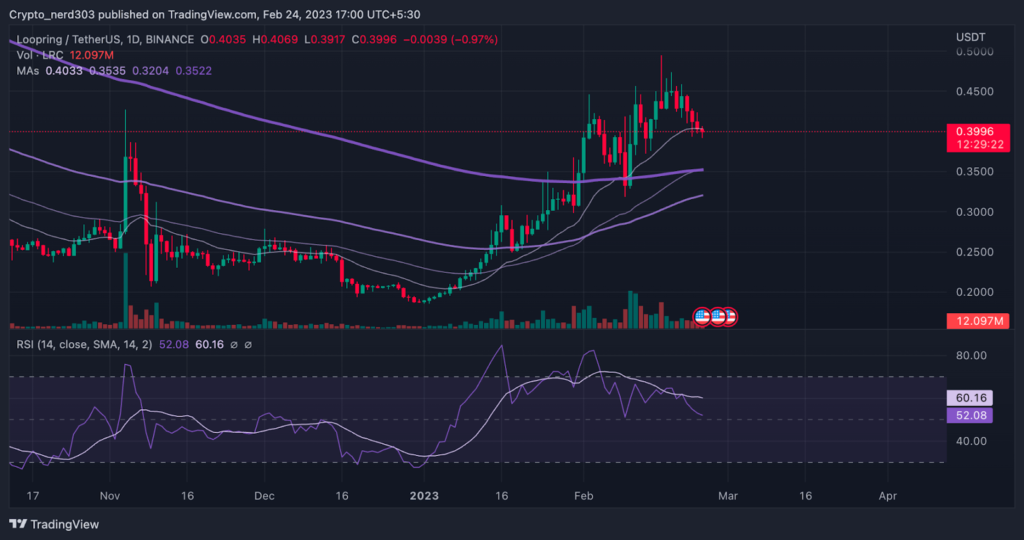
LRC price after crossing over the 20 EMA and the 50 EMA has been trending on a bull trend it broke out of the 100 EMA in early January after which LRC price broke out of the 200 EMA after consolidating for a bit officially changing bear trend in the favor of the bull trend. Loopring is getting positive support from buyers for the last couple of months. But will the buyers continue supporting the Loopring price at current levels?

Technical Analysis (1 Day timeframe)
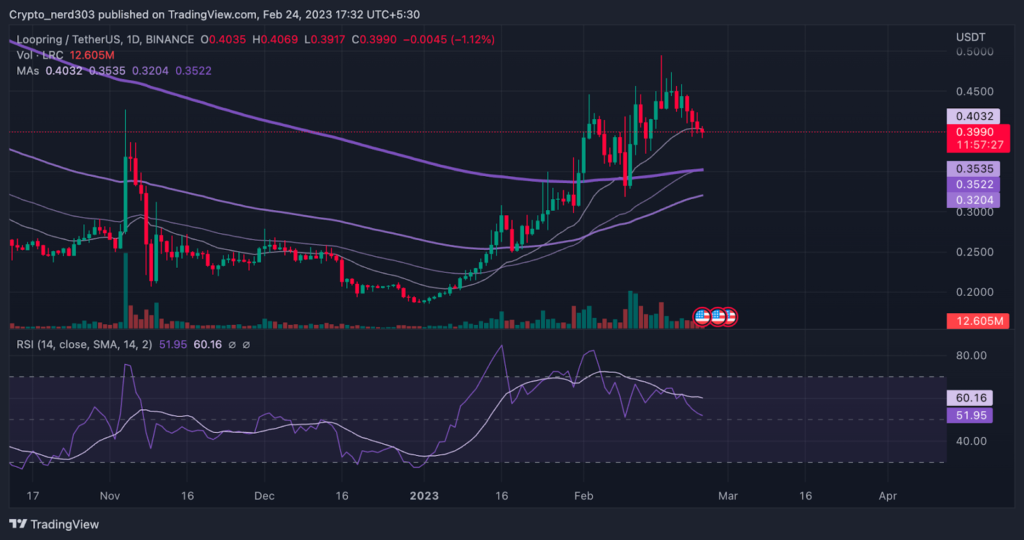
The Moving Averages are currently providing bullish indications regarding the upcoming trend the 20 EMA faster-moving averages have crossed over all the major EMA’s providing a golden cross over where the other EMA’s are also crossing over the 200 EMA. But currently, the price is crossing below 20 EMA while the 200 moving average is just below the 20 EMA acting as LRC’s most recent support.
LRC price is crossing down its most recent support at a price of $0.40 while its next support is 12% below the current price of around price $0.35 and LRC price’s next resistance is 24% above its current level around the price of $0.50
The RSI line is taking divergence from the price action while the Loopring price is giving a higher high and higher low pattern RSI line is making a lower high and lower low pattern. The RSI line is trading near the median line at 52.06 points under 14 SMA which is trading around 60.16 points.
Conclusion
As can be concluded from the above analysis LRC price is trading near the supply zone moving toward the demand zone steadily while the RSI indicator is also suggesting that the LRC price might soon start moving downward making a correction of about 10 – 15% in the recent days.
Technical levels –
Support – $0.40 and $0.35
Resistance – $0.50
Disclaimer
The views and opinions stated by the author, or any people named in this article, are for informational purposes only, and they do not establish financial, investment, or other advice. Investing in or trading crypto assets comes with a risk of financial loss.

Nancy J. Allen is a crypto enthusiast, with a major in macroeconomics and minor in business statistics. She believes that cryptocurrencies inspire people to be their own banks, and step aside from traditional monetary exchange systems. She is also intrigued by blockchain technology and its functioning. She frequently researches, and posts content on the top altcoins, their theoretical working principles and technical price predictions.


