
 Home
Home News
News

- 1 NEAR Protocol token was currently at $2.33 with an increase of 1.08% during the intraday trading session.
- 2 The 24-hour low of NEAR was $2.30 and the 24-hour high of NEAR was $2.38.
- 3 The current NEAR Protocol token price is between 100, and 200-Day EMA.
The pair of NEAR/BTC was currently trading at 0.00009955 BTC with a dip of 0.06% over the intraday trading session.

NEAR Protocol price analysis suggests that the token is in a downtrend. 2022 can be said to be not a good year as the token was in steep decline till MAY 2022 and even when bulls tried to push the token upwards towards its previous high, bears took back the market pushing the token back and forcing the token to enter its demand zone or accumulation zone. On the last day of 2022, the token makes its new 52-week low. But after the start of 2023, the bull came back and pushed the token upwards helping it to break its primary support.

After reaching its primary resistance the token began consolidating between its primary resistance of $2.746 and its primary support of $2.063. This indicates that both buyers and sellers are in a stalemate and none got the upper hand in the market which can be seen by the wave pattern formed between its primary resistance and support. If the token breakout its consolidation below its primary support then sellers may try to push the token back into its demand zone or if it breakout the consolidation above its primary resistance then buyers may help the token to reach its secondary resistance of $3.870.
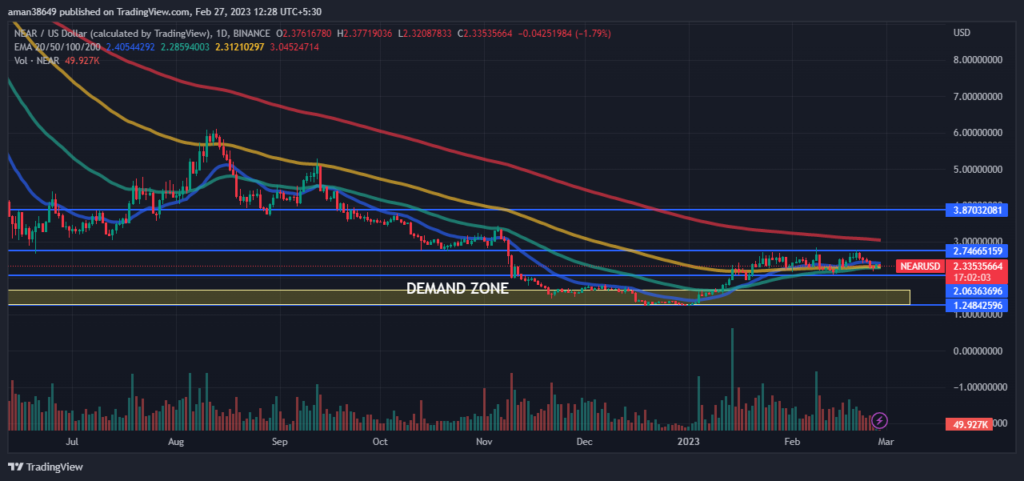
The volume of the coin has decreased by 27.05% in the last 24 hours. The decrease in volume indicates that the number of sellers has increased. This shows that sellers are trying their best and there is no relationship between volume and the price of NEAR, which represents a strength in the current downtrend or a possible reversal.
The technical analysis of NEAR Protocol
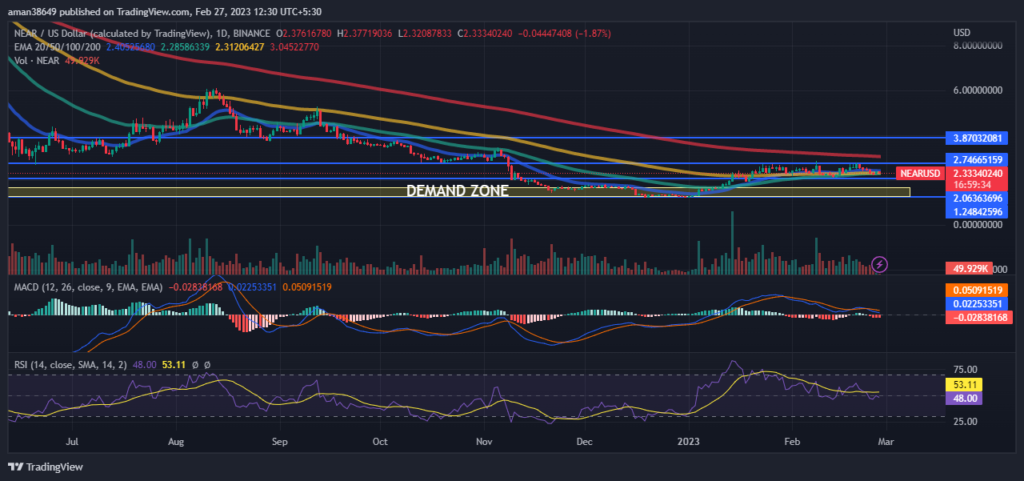
RSI is decreasing in the oversold zone and is showing signs of a negative crossover which indicates that the sellers are coming in the majority and pushing NEAR downwards. This suggests the strength of the current bearish trend. The current value of RSI is 48.01 which is below the average RSI value of 53.11.
The MACD and the signal line are decreasing and intersecting but not giving any definitive crossover or evidence to support the RSI claims. Investors need to watch every move over the charts during the day’s trading session.
Conclusion
NEAR Protocol price analysis suggests that the token is in consolidation but bears are in control of the token. This can be seen by the decrease in volume which indicates the negative market sentiment. RSI and MACD both have given a negative crossover and are decreasing which shows strength in the current bearish trend. Traders should wait for any significant movement before entering the market.
Technical Levels-
Resistance level- $2.746 and $3.870
Support level- $2.063 and $1.248
Disclaimer-
The views and opinions stated by the author, or any people named in this article, are for informational purposes only, and they do not establish financial, investment, or other advice. Investing in or trading crypto assets comes with a risk of financial loss.

Nancy J. Allen is a crypto enthusiast, with a major in macroeconomics and minor in business statistics. She believes that cryptocurrencies inspire people to be their own banks, and step aside from traditional monetary exchange systems. She is also intrigued by blockchain technology and its functioning. She frequently researches, and posts content on the top altcoins, their theoretical working principles and technical price predictions.


