
 Home
Home News
News

- 1 The Graph token was currently at $0.1598 with an increase of 1.63% during the intraday trading session.
- 2 The 24-hour low of GRT was $0.1544 and the 24-hour high of GRT was $0.1628.
- 3 The current Quant token price is above 20, 50, 100, and 200-Day EMA.
The pair of GRT/BTC was currently trading at 0.00000685 BTC with a dip of 1,01% over the intraday trading session.

The Graph price analysis suggests that the token is in a bullish phase. From the analysis of the 2022 GRT trading chart, it can be said that it was not a good year for the token. For most of the year, the token was in hands of sellers causing the token to be in a downtrend for most of the year. Near the end of the year, sellers forced the token into its demand zone which resulted in the token making its all-time low on the last day of the year. But after the start of 2023, the token started rising breaking its primary support and resistance and even breaking its secondary resistance. Soon after breaking the secondary resistance bears became active and made a powerful entry into the market by taking down the token below its primary resistance which showed that the previous breakout was a false breakout.

The token was in decline but after the formation of the Morning star chart pattern over the trading chart, the token showed a reversal on the chart which can be seen by the bullish marubozu candlestick. This indicates that the buyers are coming back into the market and driving the token up. This is a make-or-break situation for the buyers if the buyers successfully take over the market then the token may reach its primary resistance but if that not happened then sellers may take the token in their hands and push it back to its demand zone.
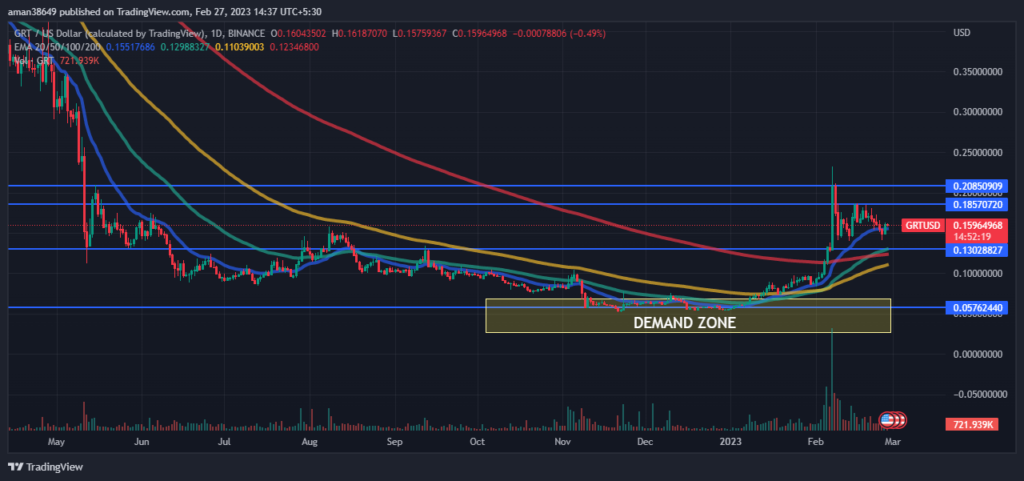
The volume of the coin has decreased by 5.66% in the last 24 hours. The decrease in volume indicates that the number of sellers has increased. This shows that sellers are trying their best and there is no relationship between volume and the price of GRT, which represents a weakness in the current bullish phase and a possible reversal.
The technical analysis of The Graph:
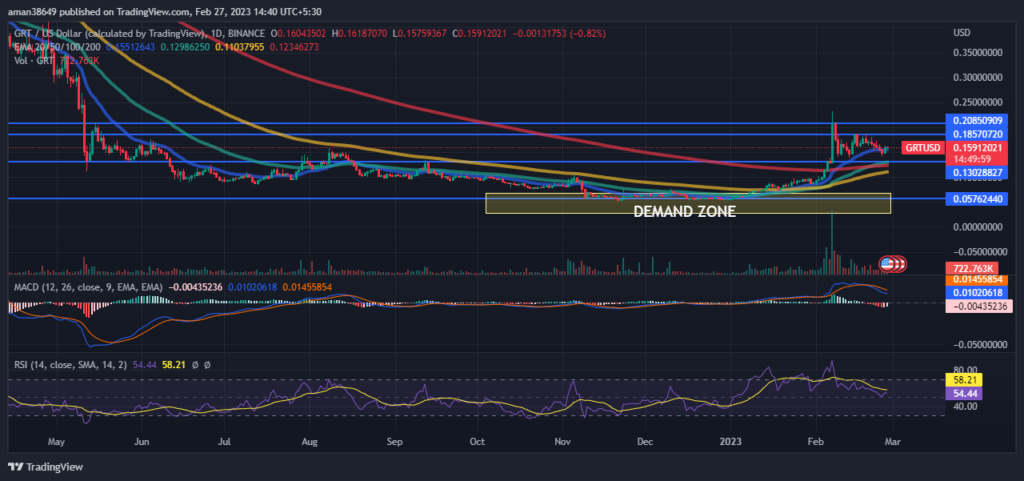
RSI is decreasing in the overbought zone and is showing signs of a negative crossover which indicates that the sellers are coming in the majority and pushing GRT downwards. This suggests the weakness of the current bullish trend. The current value of RSI is 54.30 which is below the average RSI value of 58.20.
The MACD and the signal line are decreasing and intersecting and showing a negative crossover which supports the RSI claims. Investors need to watch every move over the charts during the day’s trading session.
Conclusion
The Graph price analysis suggests that it is in a bullish phase. 2022 was not a good year for the token which can be seen by the fact that the token made its all-time low on the last day of the year. After the start of 2023, the token was rising even breaking its secondary resistance but soon after bears took over the market which showed that the breakout was a false breakout. The token has shown a reversal on the chart due to the formation of the morning star pattern. Traders should take caution before making any trade in the market.
Technical Levels-
Resistance level- $0.185 and $0.208
Support level- $0.130 and $0.057
Disclaimer-
The views and opinions stated by the author, or any people named in this article, are for informational purposes only, and they do not establish financial, investment, or other advice. Investing in or trading crypto assets comes with a risk of financial loss.

Nancy J. Allen is a crypto enthusiast, with a major in macroeconomics and minor in business statistics. She believes that cryptocurrencies inspire people to be their own banks, and step aside from traditional monetary exchange systems. She is also intrigued by blockchain technology and its functioning. She frequently researches, and posts content on the top altcoins, their theoretical working principles and technical price predictions.


