
 Home
Home News
News
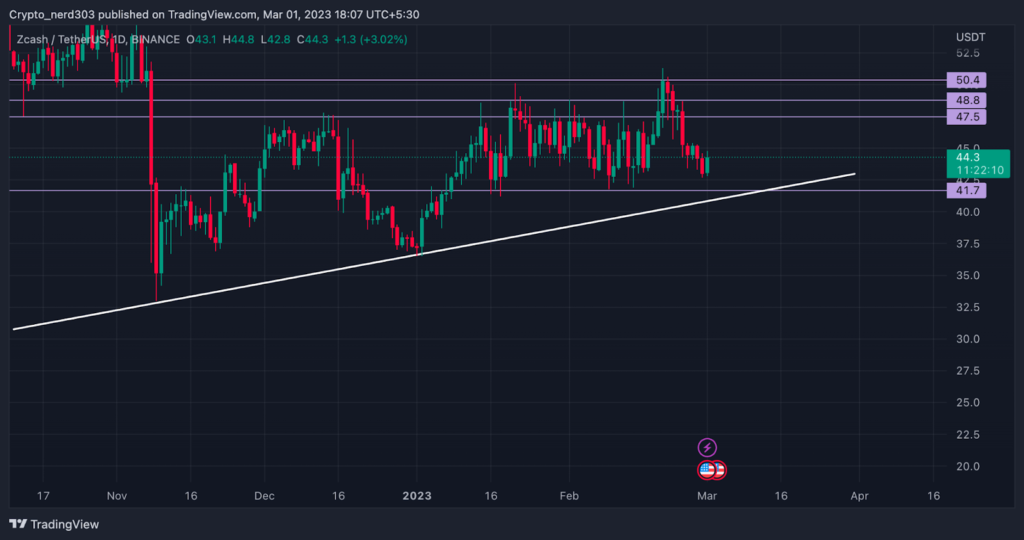
- 1 ZEC price is currently consolidating within a range
- 2 ZEC price is making a bullish engulfing candle
Zcash(ZEC) price, after giving a rally of 35% has been consolidating within a range giving a move of 15 – 21%. ZEC is trading under the 200 EMA in a downtrend while some of the EMA’s are making a convergence. The volumes have been increasing steadily from the last months showing that the buyers are taking interest in ZEC coins. Although recently after giving a correction of 14% ZEC price is making a bullish pattern which indicates that it might be preparing for a correction. The current price of ZEC is $44.4 with a change in 24-hour trading volume of 4%. Zcash is up 1.20% in the last 24 hours.

ZEC price gearing up for a rally
The overall market sentiments are currently trading at a neutral level of around 50 points according to the Alternative(dot)me, which measures the market sentiments. Although the market is currently being overpowered by the short sellers (bears) by 53 – 58% according to Coinglass which provides information on cryptocurrency and a futures trading platform.

Technical Analysis ( 1 Day Timeframe )
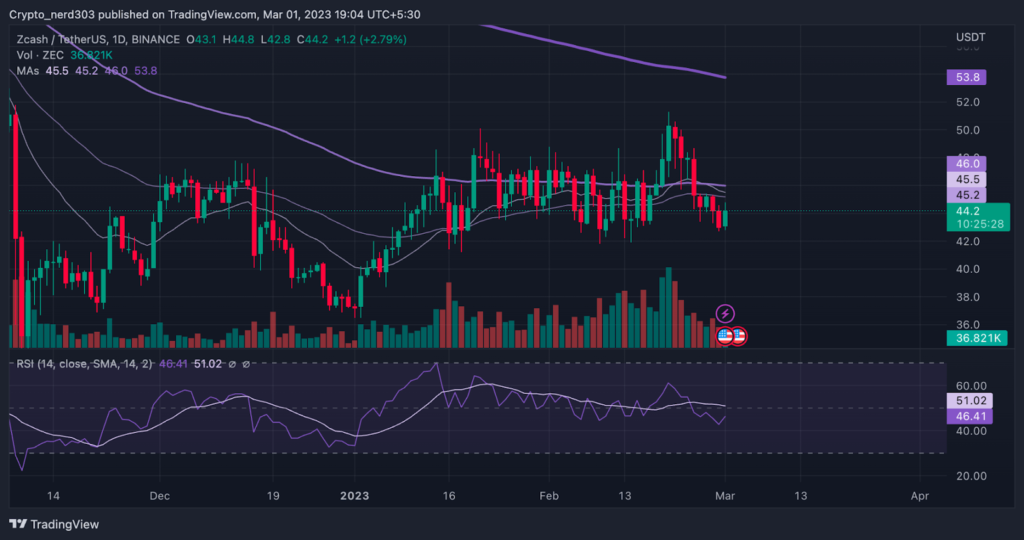
Zcash is currently consolidating around a convergence made by the 20,50 and 100 EMA while trading below the 200 EMA in a downtrend. The consolidation suggests that after breaking out of this range price might make a new trend.
The ZEC price is currently taking support from the price of $42.6 while its next support level is around the price. While its current resistance is 7% above the current price around level 47.5, the next major resistance for the ZEC price is 10% above the present price at a level of $48.8.
The RSI line is currently trading near the oversold level below the median line around point $46.41. Although the upward RSI curve is suggesting that the RSI line might start moving towards the overbought level. The 14 SMA is near the median line providing resistance to the RSI line.
Technical levels –
Support – $42.6
Resistance – $47.5 and $48.8
Conclusion
The ZEC price is currently trading on a bearish trend under the 200 EMA while trading between the convergence of major key averages. An increase in the volume suggests that there is an increase in the buying and selling activities although according to the above-mentioned sources it can be estimated that the bears are currently dominating the market.
Disclaimer
The views and opinions stated by the author, or any people named in this article, are for informational purposes only, and they do not establish financial, investment, or other advice. Investing in or trading crypto assets comes with a risk of financial loss.

Andrew is a blockchain developer who developed his interest in cryptocurrencies while pursuing his post-graduation major in blockchain development. He is a keen observer of details and shares his passion for writing, along with coding. His backend knowledge about blockchain helps him give a unique perspective to his writing skills, and a reliable craft at explaining the concepts such as blockchain programming, languages and token minting. He also frequently shares technical details and performance indicators of ICOs and IDOs.


