
 Home
Home News
News

- 1 HBAR coin price is on the rise as it managed to break an important supply zone on the daily time scale.
- 2 HBAR coin price has formed a falling wedge pattern on the daily time scale.
- 3 The pair of HBAR/BTC is trading at the price level of $0.00000269 with an increase of 1.26% in the past 24 hours.
HBAR coin price has been trading above the supply zone as it now falls back to the breakout zone to retest for further moves. As of now, the HBAR coin price is forming a lower low and lower high price structure on a daily time scale. Hedera (HBAR) is currently trading at the price level of $0.0662.

HBAR Coin Price Retraces to the Breakout Zone
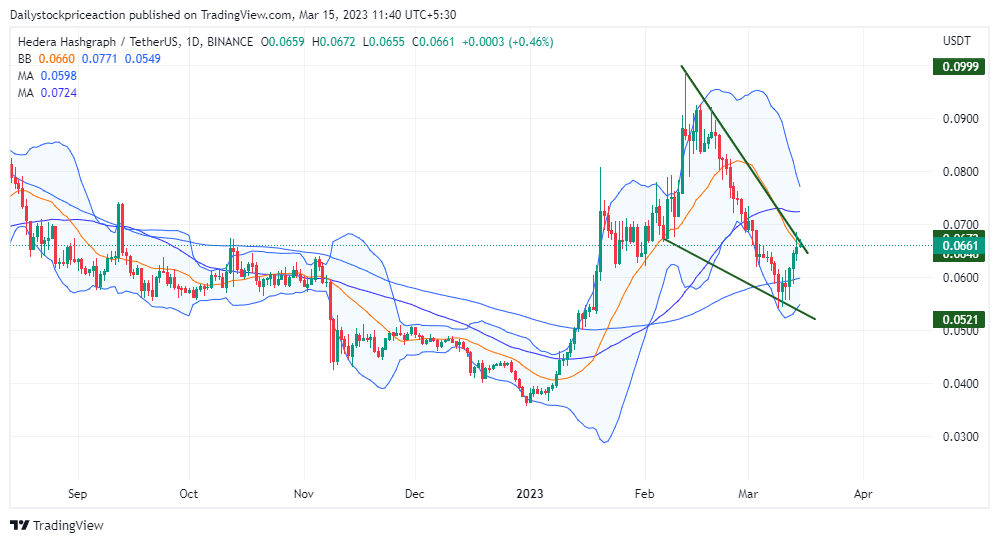
HBAR coin price movement is showing a strong bullish trend on the daily time frame. The HBAR coin price has been trading above the 50 and 100 Moving Averages. HBAR coin price moving upwards can be seen taking support at these MAs. HBAR coin price is forming a negative price structure.

AS of now, the HBAR coin price is trading at the lower band of the bollinger band indicator. This comes after the coin price failed to surpass the upper band. The coin price has also broken the 15 EMA indinacting some bearishness for the short term before further moves. Volumes have increased as the coin price fell to the demand zone. Investors should remain cautious and wait for a proper breakout and act accordingly.
HBAR Coin Price Forms a Falling Wedge Pattern
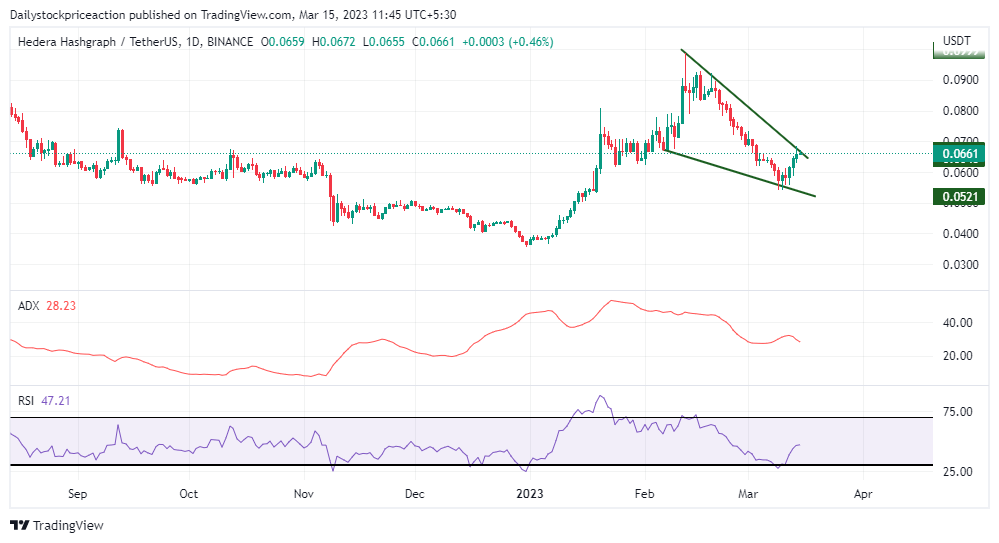
HBAR coin price, as the ADX curve is indicating a slight fall in the coin price. The HBAR coin price is falling and the same is depicted in the technical parameters. As of now, the ADX curve is transacting at the level of 28.33. It’s moving upwards and if the coin price successfully breaks the supply zone then the ADX will rise.
Relative Strength Index (RSI) has been falling from the overbought zone. The RSI curve is currently transacting at the price 47.21. Once the coin price surpasses the supply zone on a daily time frame then the RSI curve can cross the halfway mark of 50. If the coin price does not break the supply zone then it can be seen falling further below the demand zone.
Conclusion: HBAR coin price has formed a reversal chart pattern on a daily time frame. The technical parameters are also suggesting a possible reversal as it has bottomed. If the coin price sustains the bearish pressure and bounces off the demand zone, then it could make newer highs.
Support: $0.053 and $0.049
Resistance: $0.075 and $0.079
Disclaimer
The views and opinions stated by the author, or any people named in this article, are for informational ideas only, and they do not establish financial, investment, or other advice. Investing in or trading crypto assets comes with a risk of financial loss.
Steve Anderson is an Australian crypto enthusiast. He is a specialist in management and trading for over 5 years. Steve has worked as a crypto trader, he loves learning about decentralisation, understanding the true potential of the blockchain.


