
 Home
Home News
News
- 1 ZIM stock holds above 20 EMA shows strength over the charts
- 2 Bulls are looking to close above $25 to extend traction in price
ZIM stock (NYSE: ZIM ) is looking for a bounce above $25 to fold seller’s positions. The previous gap is the immediate hurdle near $25, where bulls pause register breakout. Despite the selling pressure in the past few days, buyers are trying to accumulate now. Also, cup and handle formation on charts favors bulls to trap bears now. On 13 March, ZIM stock reported Q4 2022 earnings reports which were above the analysts’ estimates with esteemed guidance from the company.

ZIM integrated shipping services stock was in the seller’s control for the past weeks, but the recent earnings reports praise bulls for attaining momentum and shifting the price upwards. Moreover, price action suggests that ZIM stock gets support near $15. Moreover, weekly charts show a reversal pattern but face a 50 days EMA hurdle. If bulls cross above that, trajectory swings will reach $30 in upcoming sessions.

ZIM stock retrieve muscles for breakout
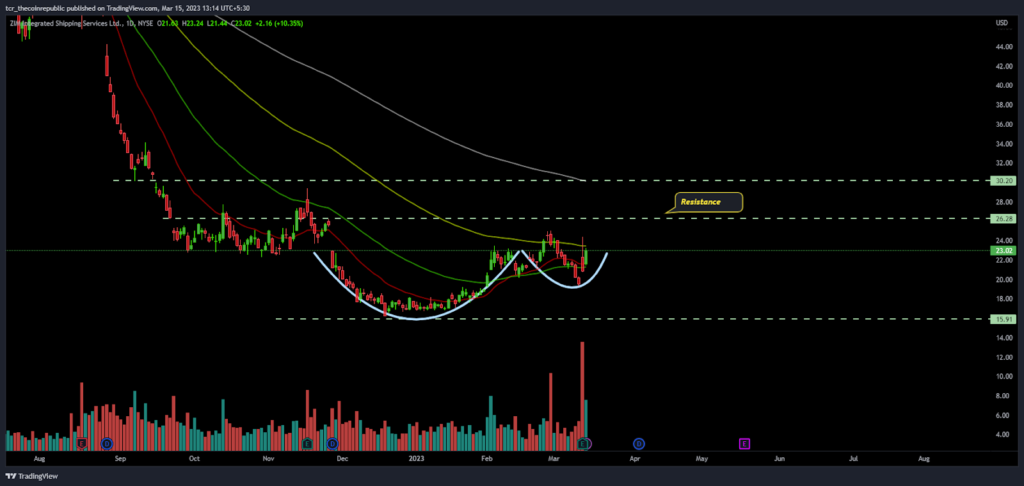
ZIM stock is willing to go above the immediate resistance of $25 to gain bullish momentum. The buyers manage to sustain the price above the middle band and try to push toward the upper Bollinger band. stock must register a breakout to achieve highs above the resistance bars. However, the stock was already corrected over the last six months, and now a pullback is expected to retest 200 days of EMA in near sessions. This week’s delivery volume noticed a spike backed by sellers during Monday’s trading session when the stock floated its earnings report.
ZIM stock was at $23.20 during Tuesday’s market session with a little upside of 0.78%, and trading volume showed a significant spike compared to past days. While buyers managed to hold prices above 20 and 50 days EMA, an early indication that buyers were healing their arms and looking to showcase strong strength.
What Technicals show
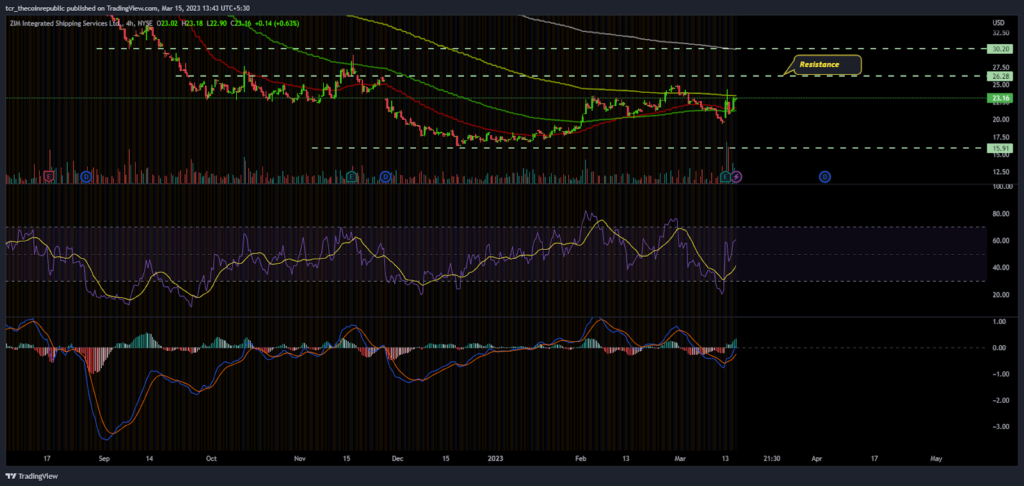
ZIM stock on the 4 hours chart shows bullish cues with a positive crossover formed on RSI indicator. The recent buying seen on stock from the last 3 days shows that buyers are attaining fresh momentum to break the barriers. The Fib levels are indicating that stock price will raise momentum when it sustains over $25. The RSI curve shows bullishness as it is placed in bullish territory near 60. The MACD indicator gave a bullish crossover this week with plotting green bars on histogram. Moreover, it shows that more upright action also can be seen holding the range near $25.
Support Levels: $20 and $15
Resistance Levels:$25 and $30
Conclusion
ZIM stock price is looking to surpass the range above $25 to bring momentum. The recent pullback from lower sides shows accumulation and demand on stock prices.
Disclaimer
The views and opinions stated by the author, or any people named in this article, are for informational purposes only, and they do not establish financial, investment, or other advice. Investing in or trading crypto assets comes with a risk of financial loss.

Nancy J. Allen is a crypto enthusiast, with a major in macroeconomics and minor in business statistics. She believes that cryptocurrencies inspire people to be their own banks, and step aside from traditional monetary exchange systems. She is also intrigued by blockchain technology and its functioning. She frequently researches, and posts content on the top altcoins, their theoretical working principles and technical price predictions.


