
 Home
Home News
News

- LTC coin price has been trading in a zig-zag trajectory as it trades inside a small narrow range.
- LTC coin price is forming a symmetrical triangle pattern on a daily time frame..
- The pair of LTC/BTC is trading at the price level of $0.0031 with an increase of 1.26% in the past 24 hours.
LTC coin price is trading in a small range as it gets ready for a big move. As the time of writing, the coin price is trading at the price level of $86.02. LTC coin price is forming a higher-high and higher-low price structure on an hourly time frame.

LTC coin price storms through every small resistance
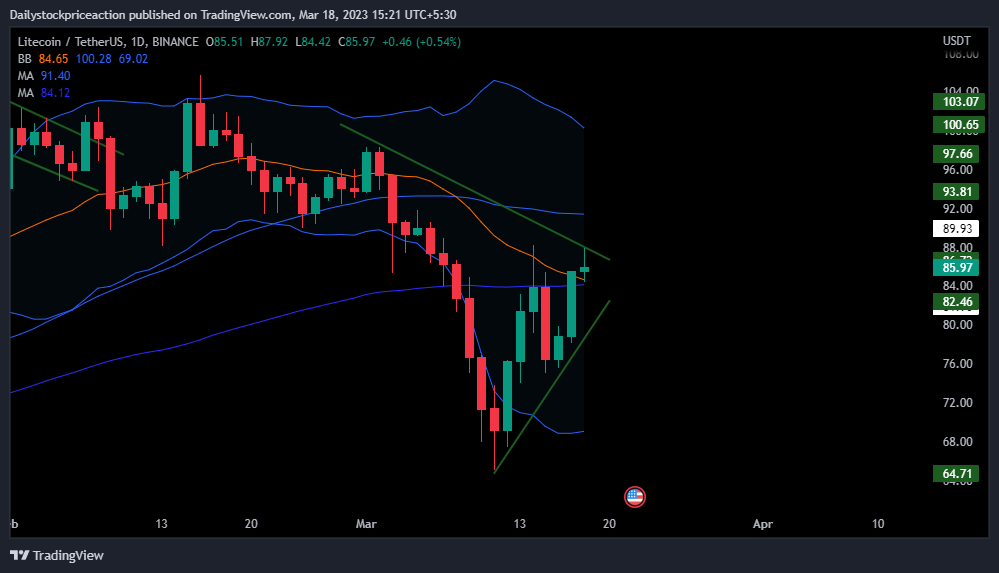
LTC coin price, as per the price action, is trading below the long term supply zone on a daily time scale. LTC coin price was recently seen bouncing off the short term demand zone which led to a strong bullish rally for a short period. LTC coin price is currently trading below the important 50 and 100 moving averages. Following a bear is pressure in the market which led to a strong fall in the LTC coin price resulting in the breakdown of 50 and 100 moving averages. Moving upward these MAs can be seen acting as a strong supply zone.

LTC coin price at present is trading at the lower band of the bollinger band. As of now, the volumes have been normal despite a small recovery. Therefore investors should exercise caution and wait for a proper breakout to consider further actions.
LTC Coin Price forms Symmetrical Triangle Pattern on a Daily Time Scale
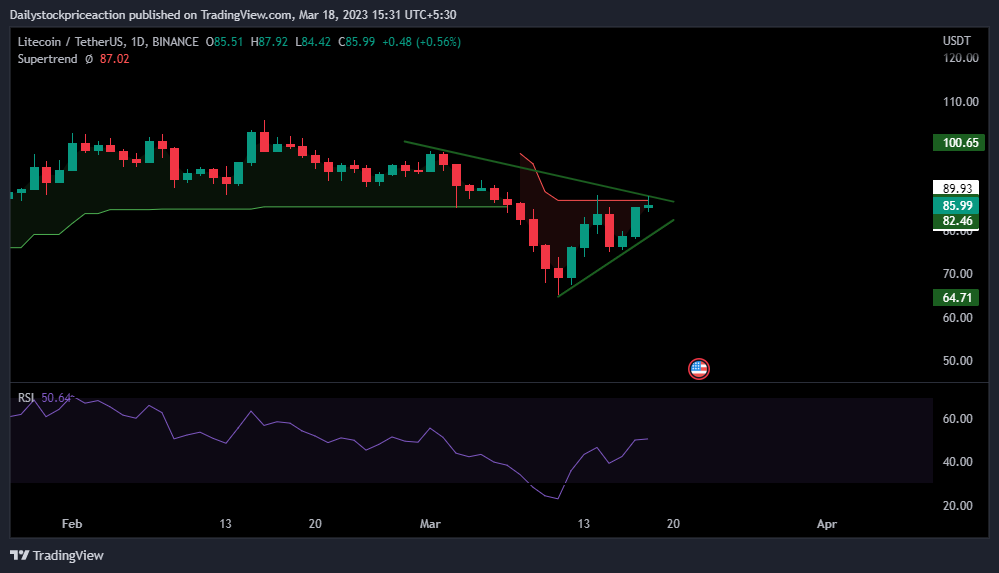
Relative Strength Index (RSI) has been falling over the past couple of trading days following bearish movements in the LTC coin price. As the LTC coin price rose from the demand zone to the previous breakdown zone, the RSI curve was also seen rising. As of now, the RSI curve is trading at 50.64. However the RSI curve has crossed the half a mark of 50. Investors should not get carried away and wait for a proper breakout of the symmetrical triangle pattern.
Supertrend indicator has triggered a negative signal as the coin price fell below the important demand zone. Previously, the level of 84 for was acting as a strong demand zone wherein the supertrend buy line was situated. Recent fall in the price of LTC coin price has led to formation of Supertrend sell line. Moving upward, this supertrend sell line can be seen acting as a strong hurdle.
Conclusion: LTC coin price, as per the price action is indicating bearishness. The technical parameters are suggesting a strong bullish move on the cards. It remains to see if the coin price will break the supply zone or fall below to the demand zone again.
Support: $80 and $75
Resistance: $90 and $110
Disclaimer
The views and opinions stated by the author, or any people named in this article, are for informational purposes only, and they do not establish financial, investment, or other advice. Investing in or trading crypto assets comes with a risk of financial loss

Nancy J. Allen is a crypto enthusiast, with a major in macroeconomics and minor in business statistics. She believes that cryptocurrencies inspire people to be their own banks, and step aside from traditional monetary exchange systems. She is also intrigued by blockchain technology and its functioning. She frequently researches, and posts content on the top altcoins, their theoretical working principles and technical price predictions.


