
 Home
Home News
News

- Mina was at $0.9136 at press time, with an increase of 9.82% during the intraday trading session.
- The 24-hour low of MINA was $0.8332 and the 24-hour high was $0.944.
- The current Mina token price is above 20, 50, 100, and 200-Day EMAs.
The pair of MINA/BTC was trading at $0.00003325 BTC with a rise of 4.59% over the intraday trading session.

Mina price prediction suggests that it is currently in an uptrend after the formation of the morning star candlestick pattern over the daily trading chart. On the first day of 2023, MINA token marked its new 52-week low. But after marking its new 52-week low, the buyers became hyperactive in the market which helped MINA token move upwards. The token broke its primary support and resistance with the support of buyers even breaking its secondary resistance of $0.980. But as soon as the MINA token breached its secondary resistance, sellers again came back into the market pushing the token below its primary resistance of $0.832 which might be the cause of the previous downtrend.

The formation of the morning star candlestick pattern after a downtrend indicates the start of an upward climb. It is a sign of a reversal in the previous price trend. Traders can seek confirmation that a reversal is indeed occurring using additional indicators. This might be the cause of the current uptrend as can be seen in the daily trading chart.
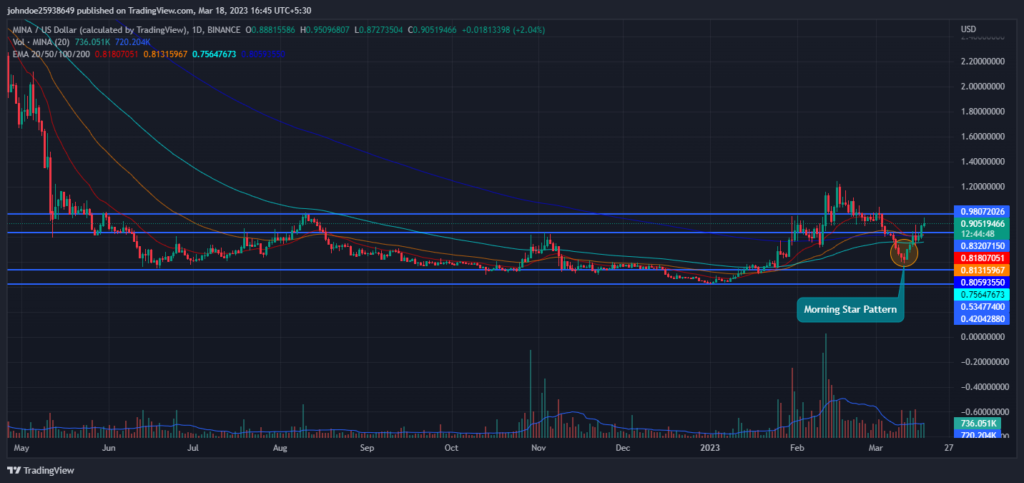
The volume of the coin has increased by 120.23% in the last 24 hours. The increase in volume indicates that the number of buyers has increased.
Mina Price Technical Analysis:
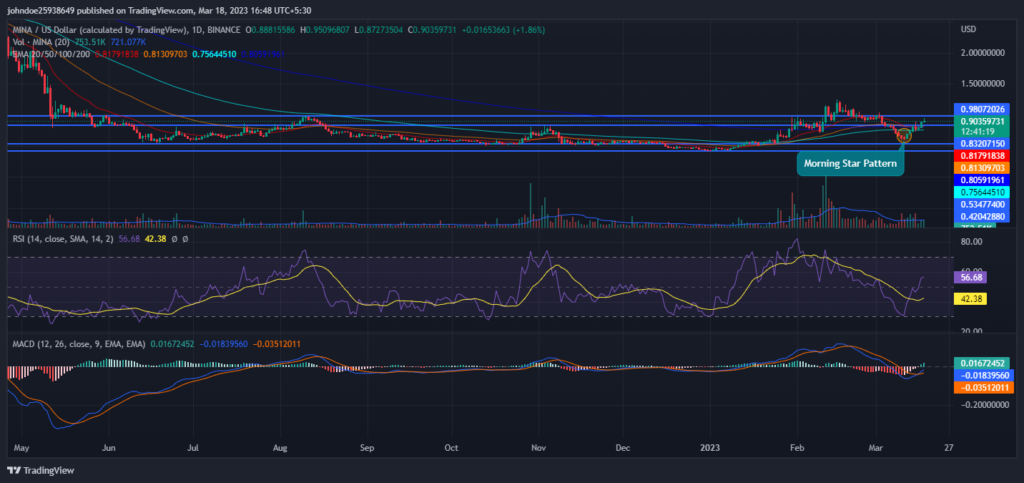
RSI is heading toward the overbought zone and is shown a positive crossover which indicates that the buyers are coming in the majority and pushing MINA upwards. This suggests the strength of the current bullish trend. The current value of RSI is 56.53 which is below the average RSI value of 42.37.
The MACD and the signal line are rising and showing a positive crossover over the daily chart which supports the RSI claims.
Conclusion
Mina price prediction suggests that it is currently in an uptrend after the formation of the morning star candlestick pattern over the daily trading chart. From the start of 2023, the MINA token is seeking stability in the market. The big increase in the trading volume in the last session shows the positive market sentiment towards the MINA token. RSI and MACD are increasing and showing a positive crossover over the daily trading chart indicating the strength in the current uptrend, as per the technical indicators.
Technical Levels-
Resistance level- $0.832 and $0.980
Support level- $0.534 and $0.420
Disclaimer-
The views and opinions stated by the author, or any people named in this article, are for informational purposes only, and they do not establish financial, investment, or other advice. Investing in or trading crypto assets comes with a risk of financial loss.

Andrew is a blockchain developer who developed his interest in cryptocurrencies while pursuing his post-graduation major in blockchain development. He is a keen observer of details and shares his passion for writing, along with coding. His backend knowledge about blockchain helps him give a unique perspective to his writing skills, and a reliable craft at explaining the concepts such as blockchain programming, languages and token minting. He also frequently shares technical details and performance indicators of ICOs and IDOs.


