
 Home
Home News
News

- American Airlines stock price has breached its prior resistance and now it’s make-or-break for AAL.
- American Airlines share price decreased 0.14% during Monday’s trading session with an opening price of $14.02 and a closing price of $13.96.
- American Airlines share price is trading below the 20, 50, 100, and 200-Day EMAs.
American Airlines stock price was at $13.96 with a decrease of 0.14% in Monday’s trading session. The trading volume rose above the average during Friday’s trading session. The increase in volume shows the positive market sentiment towards the AAL stock. The formation of the long-legged doji after a downtrend over the daily time frame chart may start a make-or-break scenario for the AAL stock in the market.

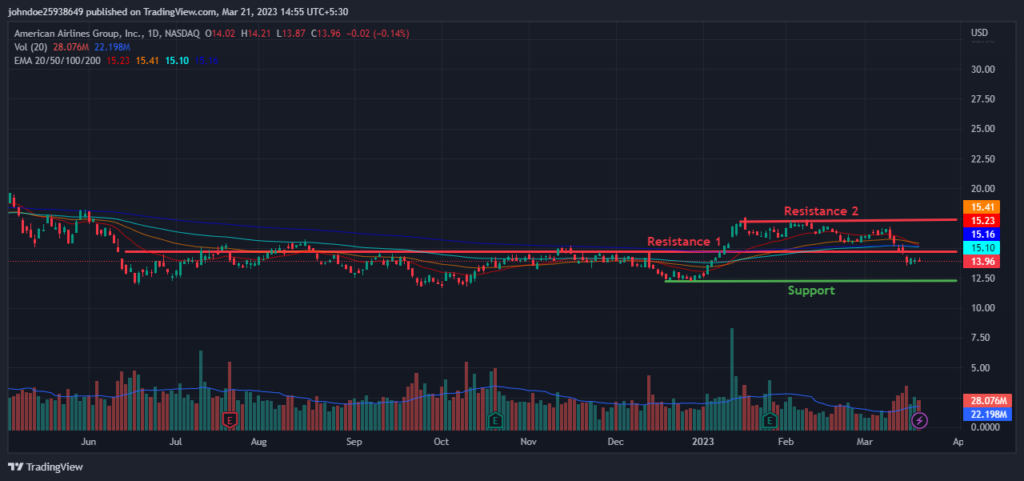
From the start of 2023, American Airlines stock price started its upwards movement with the support of active bulls in the market. This helped the AAL stock in breaking its primary resistance of $14.73 and further helped the stock to reach its secondary resistance of $17.41.The American Airlines stock tried to break its secondary resistance with the help of active buyers in the market to continue its bullish momentum but the bears became active which caused the stock to decline. This made the prior breakout a false breakout as can be seen over the daily time frame chart.

After this, the American Airlines stock tried to break its secondary resistance with the help of active buyers in the market but every time it resulted in a failed attempt. This shows that the secondary resistance area is acting as a distribution phase where sellers are positioned to push the stock down. After the last failed attempt the bears tried to completely control the market which forced the American Airlines stock to break its primary resistance.
But the formation of long-legged doji after a downtrend suggests that the forces of supply and demand are nearing equilibrium and that a trend reversal may occur. This makes the present scenario a make-or-break moment for the American Airlines stock price over the daily trading chart.
More About American Airlines Group Inc (NASDAQ: AAL):
American Airlines Group, Inc. is a holding company that provides air transportation services for passengers and cargo. Its primary subsidiary, American, operates as a network carrier. The company operates in different geographical segments, including the Department of Transportation Domestic, Department of Transportation Latin America, Department of Transportation Atlantic, and Department of Transportation Pacific. American Airlines Group was established on December 9, 2013, and its headquarters are located in Fort Worth, TX.
American Airlines Group Inc (NASDAQ: AAL) Stock Price Technical Analysis:
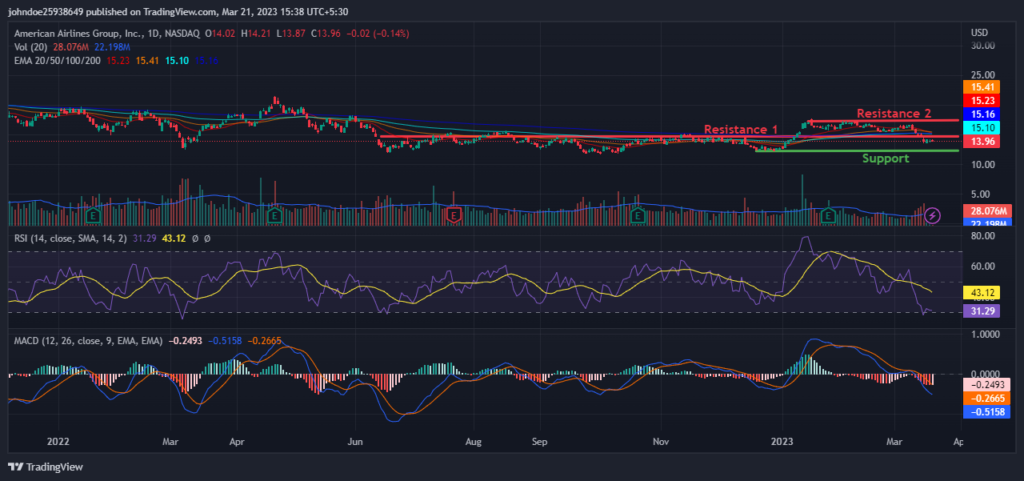
According to technical indicators, American Airlines stock price may show an downward movement. RSI is decreasing in the oversold zone and is shown a negative crossover over the daily time frame chart which indicates that the sellers are accumulating and pushing AAL downwards.
Essentially, the present bearish influence is strong. The current value of RSI is 31.29 which is below the average RSI value of 43.12. The MACD and the signal line are decreasing over the daily chart which supports the RSI claims.Investors need to watch every move over the charts during the day’s trading session.
Summary
On Monday’s trading session, American Airlines stock price was $13.96, indicating a decrease of 0.14%. The market witnessed heavy selling pressure, as evidenced by the increase in selling volume. Since the beginning of 2023, American Airlines’ stock price has been on the rise, buoyed by the active involvement of bullish traders. However, the emergence of a long-legged doji after a downtrend indicates that the forces of supply and demand are almost balanced, which could lead to a potential trend reversal. The technical indicators, including the RSI and MACD, are both declining on the daily time frame chart, suggesting that the current bearish phase is gaining momentum. Before entering the market, traders should wait for significant movements to occur.
Technical Levels
Resistance Levels: $14.73 and $17.41
Support Levels: $12.44 and $11.63
Disclaimer
The views and opinions stated by the author, or any people named in this article, are for informational purposes only, and they do not establish financial, investment, or other advice. Investing in or trading crypto or stocks comes with a risk of financial loss.

Nancy J. Allen is a crypto enthusiast, with a major in macroeconomics and minor in business statistics. She believes that cryptocurrencies inspire people to be their own banks, and step aside from traditional monetary exchange systems. She is also intrigued by blockchain technology and its functioning. She frequently researches, and posts content on the top altcoins, their theoretical working principles and technical price predictions.


