
 Home
Home News
News

- 1 After bouncing off the demand zone, ETC coin price is now trading in the supply zone.
- 2 On the 1-day chart, the ETC price is forming a symmetrical triangular pattern.
- 3 The price of the ETC/BTC pair increased by 0.95% in the last 24 hours to $0.0001576.
ETC coin price is forming a symmetrical triangle chart pattern on the 1-day chart. The coin price is forming lower-low formation from the supply zone and higher-high formation further from the demand zone. At present, the coin is trading in a narrow range and therefore breakout on either side will trigger big moves.

ETC Coin Price is Consolidating On the daily timeframe
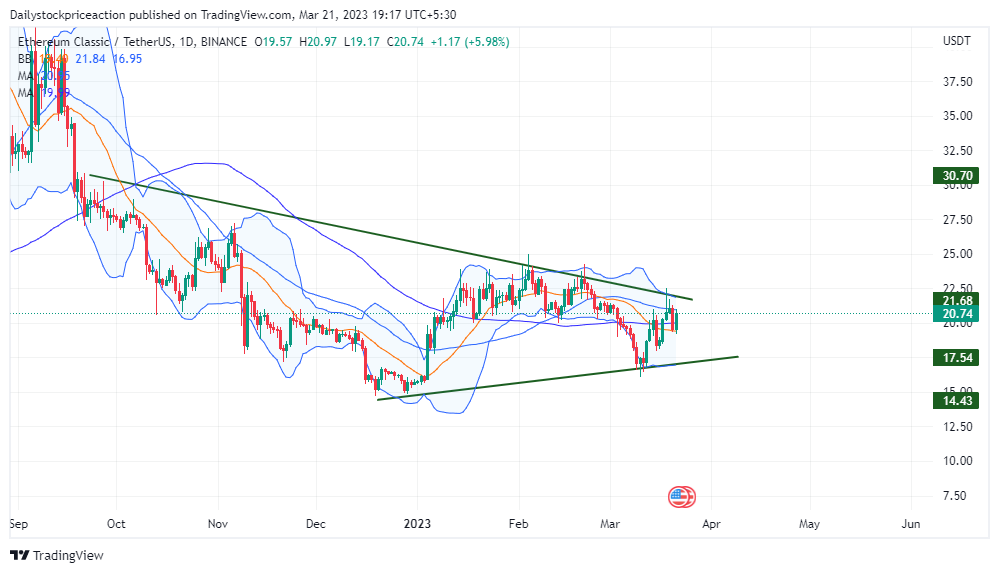
The coin price can reach the $22.70 long-term supply zone if it breaks out of the symmetrical triangle pattern. On a higher time frame, the coin price has fallen heavily and is making a lower low formation. To deny the continuation of the bearish trend on a higher time frame, the coin price needs to break out of the symmetrical triangle pattern the n on the upside. The ETC coin price is trading in the middle of the Bollinger band indicator, after bouncing off the demand zone.

ETC coin price is trading below all key moving averages. The 50- and 100-day moving averages can act as a strong supply zone in the future as the coin price tries to move up. Although the coin price broke out of the 14 SMA, a breakout from the symmetrical triangles is needed for a further up move. Volumes have been on a rise as the coin rivers around the supply zone.
The ETC Coin Price is Forming a Symmetrical Triangle Pattern on the Daily Time Frame
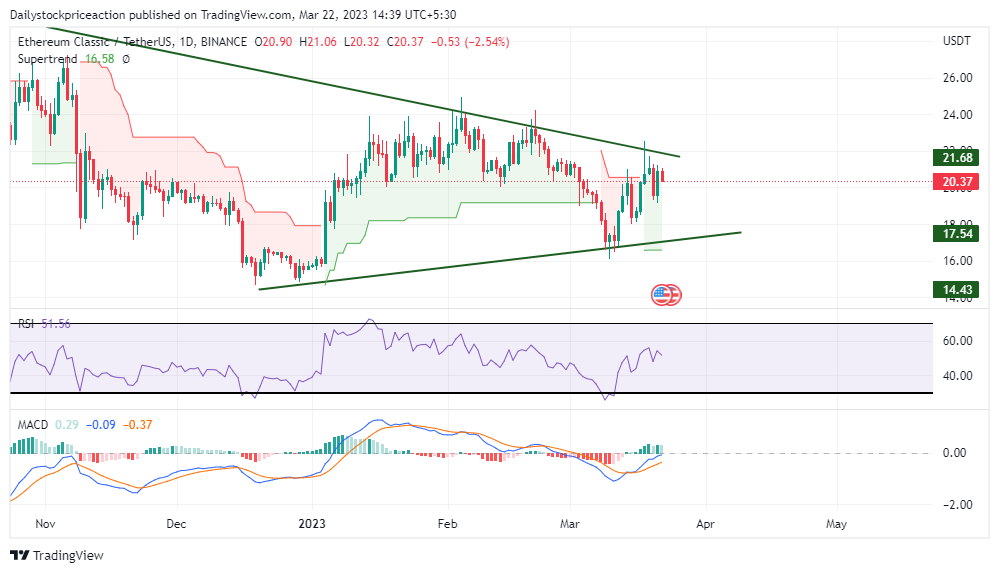
RSI curve is at 49.00 as the coin nears the supply area. At present, the RSI curve has crossed the 20 SMA. The coin is forming higher-low and higher-high formation on a 4-hour time frame as the coin shows bullishness in the larger time frame. ETC coin price can be seen moving when it breaks out of the rounding bottom pattern and the RSI curve moves higher.
MACD indicator has given a positive crossover as the coin broke out of the supply zone. The blue line crossed the orange line on the upside. This has resulted in the coin price moving up strongly in a 4-hour time frame. Recently, the ETC coin price fell after the breakout of small resistance, as a result, the MACD indicator also depicted the same. Once the coin price starts moving up again after retesting, the gap between the blue and orange lines can be seen moving apart, supporting the trend.
ETC coin price rose above the supply zone making a strong bullish candlestick pattern. The coin broke out of the super trend sell line which triggered the buy signal. At the time of writing, ETC coin is trading above the super trend buy signal line. Going forward, this line could act as a strong support zone.
Conclusion: ETC coin price is trading in a strong bullish trend as seen on a 4-hour time frame. While on a daily time frame the coin price has been consolidating near the supply zone. The coin price is forming a symmetrical triangle pattern on a daily time frame. Investors should wait for a breakout from the symmetrical triangle and act accordingly.
Support: $18.00 and $16.10
Resistance: $22.70 and $24.60
Disclaimer
The views and opinions stated by the author, or any people named in this article, are for informational purposes only, and they do not establish financial, investment, or other advice. Investing in or trading crypto assets comes with a risk of financial loss

Nancy J. Allen is a crypto enthusiast, with a major in macroeconomics and minor in business statistics. She believes that cryptocurrencies inspire people to be their own banks, and step aside from traditional monetary exchange systems. She is also intrigued by blockchain technology and its functioning. She frequently researches, and posts content on the top altcoins, their theoretical working principles and technical price predictions.


