
 Home
Home News
News

- Ethereum is trading at $1,793.48 (press time) with an increase of 3.43% during the intraday trading session.
- The 24-hour low of ETH was $1,730.78 and the 24-hour high of ETH was $1,836.29.
- The current Ethereum price is above 20, 50, 100, and 200-Day EMA.
The pair of ETH/BTC was trading at $0.06357 BTC with a rise of 1.02% over the intraday trading session.

Ethereum price prediction suggests that it is currently in an uptrend, trading above its 20-Day EMA. This shows that there is bullish strength remaining in the market. From the start of 2023, ETH token was moving upward using the accumulated support of buyers after experiencing its bear market in 2022. But after breaking its primary support of $1500.47, ETH token began consolidating between its primary support and resistance which indicates that the demand and supply in the market were in equilibrium. It took two attempts for the ETH token to break its primary resistance of $1727.94.

Sellers tried their best to push the ETH token below its primary support but after the formation of the hammer candlestick over the daily time chart, buyers became active again in the market. This may be the cause of the current bullish uptrend. The formation of the hammer pattern after a downtrend over the daily trading chart indicates a bullish reversal on the chart. The area between the primary and secondary resistance is acting as a distribution phase or supply zone for ETH.
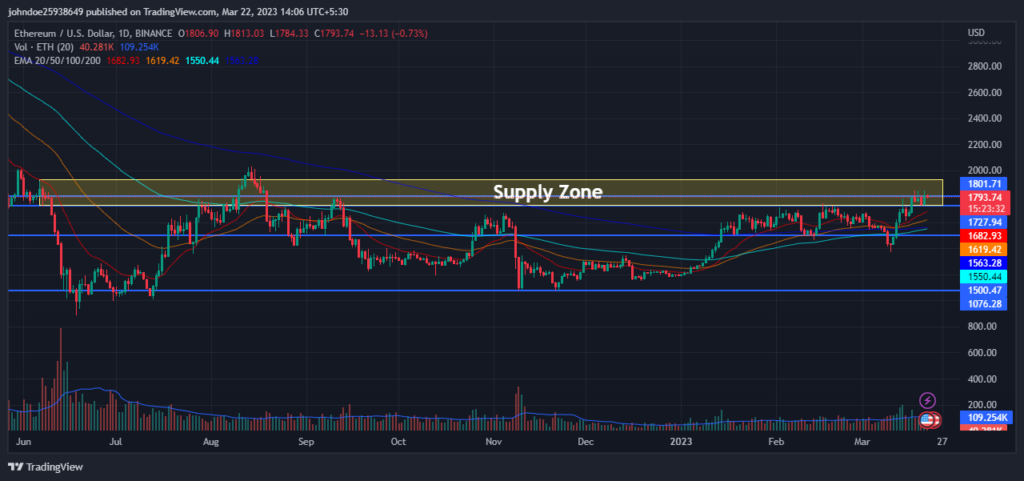
The volume of the coin has increased by 9.27% in the last 24 hours. The increase in volume indicates that the number of buyers in the market has increased. This shows that buyers are trying their best and there is a relationship between the volume and the price of ETH, which represents strength in the current bullish phase.
Ethereum Price Technical Analysis:
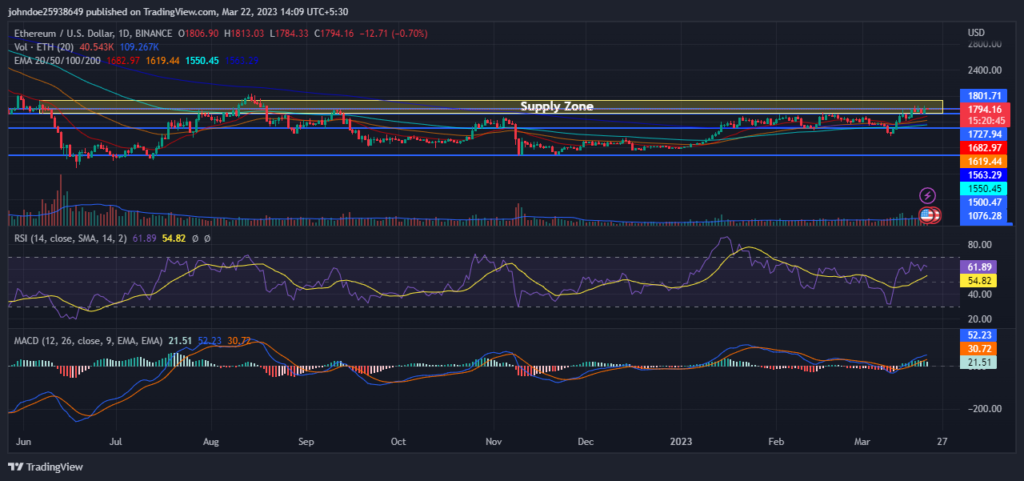
RSI is increasing in the overbought zone and is showing a positive crossover which indicates that the buyers are coming in the majority and pushing ETH upwards. This suggests the strength of the current bullish trend. The current value of RSI is 61.90 which is above the average RSI value of 54.83.
The MACD and the signal line are intersecting and show a positive crossover over the daily chart which supports the RSI claims. Investors need to watch every move over the charts during the day’s trading session.
Conclusion
Ethereum price prediction suggests that it is currently in an uptrend trading above its 20-Day EMA. This shows that there is bullish strength remaining in the market. Sellers tried their best to push the ETH token below its primary support but after the formation of the hammer candlestick over the daily time chart, buyers became active again. The increase in trading volume shows positive market sentiment toward ETH. RSI and MACD both are increasing and showing a positive crossover over the daily chart which shows strength in the current bullish phase, as per the technical indicators.
Technical Levels-
Resistance level- $1727.94 and $1801.71
Support level- $1500.47 and $1076.28
Disclaimer-
The views and opinions stated by the author, or any people named in this article, are for informational purposes only, and they do not establish financial, investment, or other advice. Investing in or trading crypto assets comes with a risk of financial loss.

Nancy J. Allen is a crypto enthusiast, with a major in macroeconomics and minor in business statistics. She believes that cryptocurrencies inspire people to be their own banks, and step aside from traditional monetary exchange systems. She is also intrigued by blockchain technology and its functioning. She frequently researches, and posts content on the top altcoins, their theoretical working principles and technical price predictions.


