
 Home
Home News
News

- 1 The price of STX coin is rising sharply; it appears that the current market decline has had an impact on coin prices.
- 2 The price of STX coin is now forming a flag and pole pattern in a 4-hour time period.
- 3 The price of the STX/BTC pair is now 0.00004261, down 2.34% over the previous day.
STX coin price as per the price movement is indicating bullishness. The recent fall has led to investors worrying about the coin price. However, it has formed a bullish continuation price pattern. It remains to be seen if it will break out or fall.

STX Coin Price Creates Doubts Among Bulls
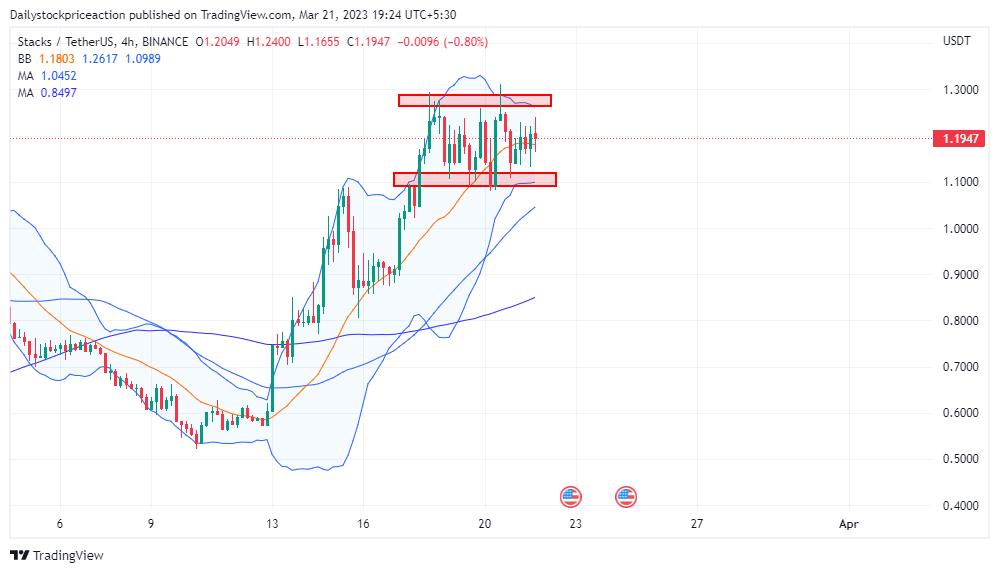
STX coin price is on the rise and has managed to reach the long term supply zone on a weekly time frame. If the coin prices manage to surpass the supply zone then it can show a strong steep move. As of now, the coin price is forming a higher high and higher low formation on a 4-hour time frame. Recent bullish love led to the breakout of the 50 and 100 Moving Averages. If it manages to sustain above these MAs then it can be seen as acting as a strong demand zone.

At present, the STX coin price is trading at the middle of the Bollinger band indicator. Previously the coin price was trading at the lower band of the Bollinger band indicator after a strong bullish move it reached the upper band but was not able to sustain at the top band. However, the volumes have increased and if the STX coin price goes past the supply zone then the volumes can be seen rising, supporting the trend.
STX coin price forms a flag and pole pattern on a 4-hour time frame
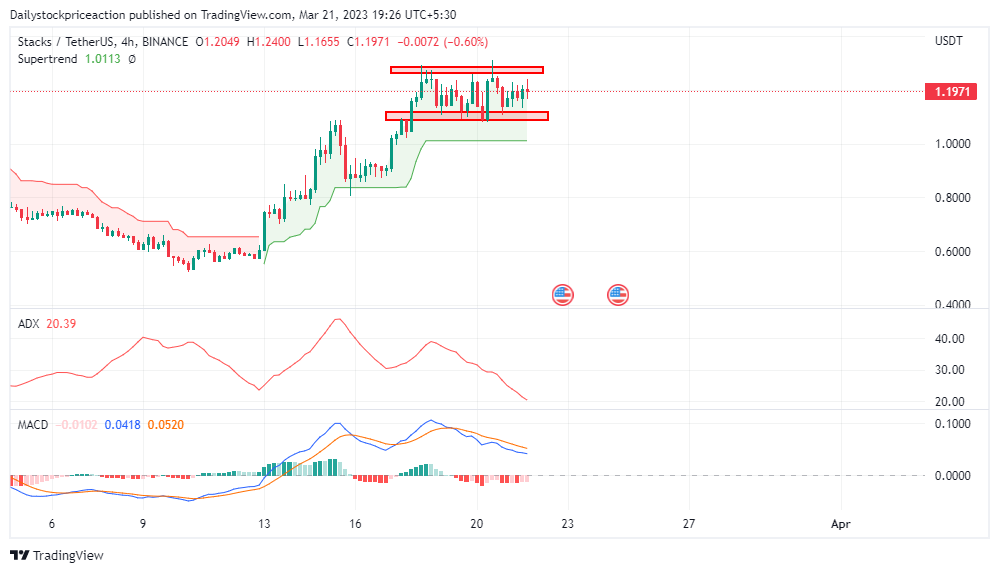
The STX coin price managed to sustain in the long term supply zone. The MACD indicator triggered a positive crossover as soon as it bounced off the demand zone. The blue line crossed the orange line on the upside. Despite the recent fall, the MACD lines are positively intact, indicating no effect from the recent brief fall.
As of now, the ADX curve is trading at the level of 21.03. This comes after the coin price crossed the short-term supply zone which led to the ADX curve dipping out of the 20 level. Moving forward, if the coin price surpasses the supply zone, the ADX curve can be seen rising to the mark of 50, supporting the trend.
Supertrend indicators like other indicators are also giving positive signals. Previously, the coin price was facing strong resistance from the super-trend sell line but recent bullishness led to the break out of the super-trend buy line. Moving upwards this line can be seen acting as a strong demand zone.
Conclusion: The coin price manages to sustain the recent fall as it shows only a brief fall compared to the overall cryptocurrency market. Possibility of moving upwards strongly with a strong bullish momentum has increased as the technical parameters indicate a bullish momentum. It remains to see if the coin price will surpass the supply zone or fall from the supply zone facing a strong pressure from the bears.
Support: $0.90 and $0.95
Resistance: $1.27 and $1.35
Disclaimer
The views and opinions stated by the author, or any people named in this article, are for informational ideas only, and they do not establish financial, investment, or other advice. Investing in or trading crypto assets comes with a risk of financial loss.
Steve Anderson is an Australian crypto enthusiast. He is a specialist in management and trading for over 5 years. Steve has worked as a crypto trader, he loves learning about decentralisation, understanding the true potential of the blockchain.


