
 Home
Home News
News

- 1 HBAR price is trading within a symmetrical triangle
- 2 HBAR price might be looking to make a breakout
HBAR price has been trading under selling pressure for the past few months. After breaking its resistance around the price of $0.0400, it made a bullish pattern gaining 95 percent of its value. It also crossed key moving averages and closed on a positive note. Although HBAR price did consolidate around the 200 EMA for a few weeks however after making a bullish piercing candle it broke above the 200 EMA with strength.

HBAR Price Trading Under 200-day EMA in a Symmetrical Triangle ( Daily Time frame)
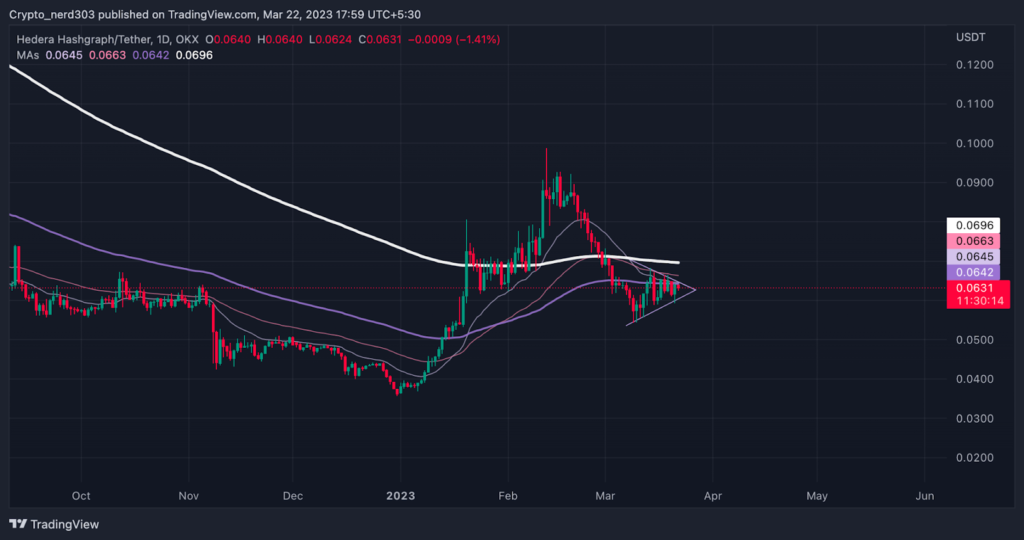
Although the buyers did not support the price above the 200-day EMA and after taking resistance at $0.0900, HBAR coin made a severe downturn. After taking rejection from the $0.0900, the price fell by 20 percent trying to find support around the 200-day EMA. But the price was not able to sustain around that level and it broke down below the 200-day EMA and other key averages with a strong bearish candle while losing 32 percent of its value.

According to Alternative(dot)me the current value of the greed and fear index is trading around 62 in the greed zone while seeing a rise of 10 points since last week when the market was trading around the neutral zone of around 50 points. The market is currently overwhelmed by the bears by 50 to 51 percent across most of the major cryptocurrency exchange platforms. In some exchange platforms, the bulls are dominating HBAR price by a good difference of 63 percent according to Coinglass.
Technical Analysis on (1 Day Time frame)
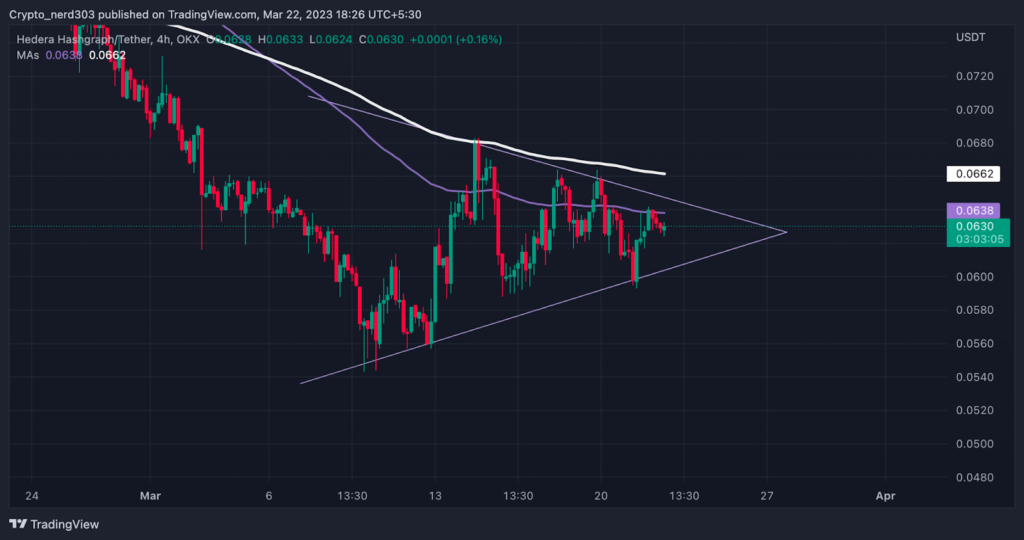
HBAR price is currently trading under the 200-day EMA in a symmetrical triangle pattern. The HBAR coin after taking support from the price of $0.560 made a bullish rally of 21 percent. After taking resistance from the 200 EMA around the price of $0.0680 HBAR is trading under a symmetrical triangle. Currently, the price is taking resistance from 100-day EMA after which it might take a pullback of 3.78 percent falling just above $0.600 which might prove to be its next support.
Conclusion
HBAR price is facing severe resistance from the 100-day EMA as of now while its next resistance is just above it around the 200-day EMA at $0.0662. The downward curve of the price is suggesting that it might favor a bearish correction.
Technical levels –
Support – $0.0610
Resistance – $0.0638
Disclaimer
The views and opinions stated by the author, or any people named in this article, are for informational purposes only, and they do not establish financial, investment, or other advice. Investing in or trading crypto assets comes with a risk of financial loss.
Steve Anderson is an Australian crypto enthusiast. He is a specialist in management and trading for over 5 years. Steve has worked as a crypto trader, he loves learning about decentralisation, understanding the true potential of the blockchain.


