
 Home
Home News
News

- 1 CAKE price might take a bearish correction in the upcoming days.
- 2 The current CAKE price is $3.70 (at press time) with a change in the 24-hour trading volume of -26 percent.
The CAKE price is currently trading at $3.70 while seeing a change of -26% in the last 24 hours. The Pancake Swap is observing a decline of 0.89% in 24 hours. After attempting to cross above its critical resistance at the $4.000 and facing severe rejection, the buyers are refusing to support CAKE at its current price and the sellers are taking over. The price is currently facing rejection from some critical price points while making bearish candlestick patterns.

CAKE Price Preparing for a Bearish Correction on (2-Day Time frame)
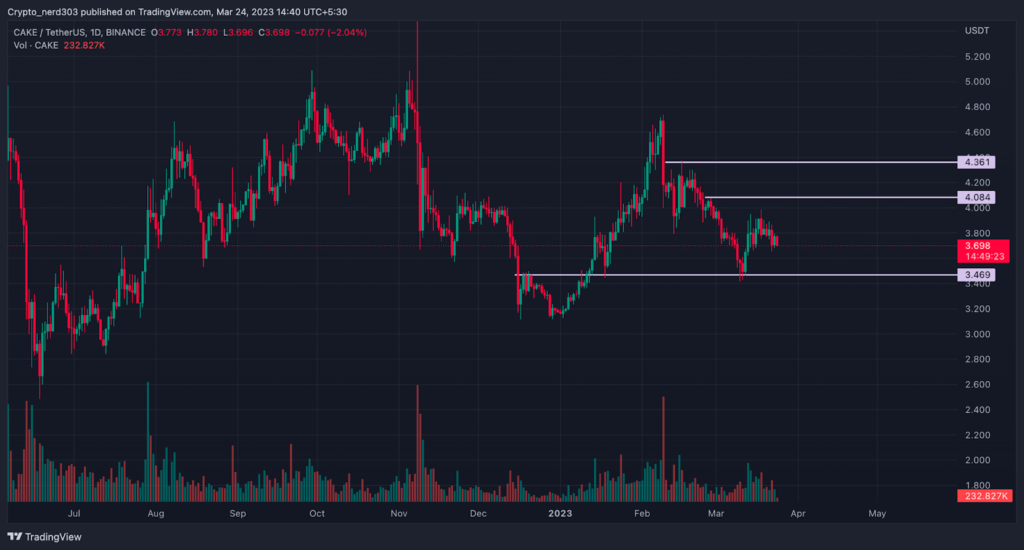
After taking support at $3.100 twice and making a double bottom pattern, CAKE price made a bullish engulfing candle. Following this, the price made an extremely bullish move and gained 46 percent of its value while also taking a small correction around the price of $3.500. Despite being bullish, the price was not able to breach the $4.800 barrier and made a downturn of 25 percent. Although the price did try to make a comeback by attempting to cross above $4.200 it could not succeed.

However, after taking support from the $3.500, CAKE price made a higher-low. This higher-low suggests that the price might be moving on an overall bullish trend although the current short-term trend seems to be bearish. After giving a bullish rally of 15 percent, the Pancake Swap price is taking resistance from $4.000 and the making of a downward curve in the price is suggesting that the price might take a bearish correction of overall 12 percent.
The overall market sentiments are currently trading in the Greed zone at 61 points while seeing an increase of 3 points in the last 24 hours showing buyers’ interest according to Alternative(dot)me.
Technical Analysis (On 1 Day Timeframe)
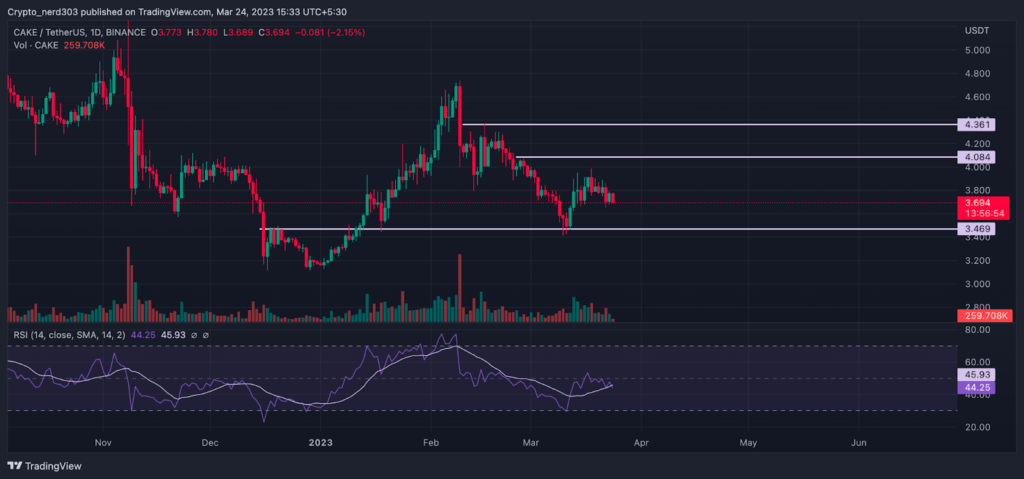
The RSI line is about to cross the median line (at press time) while making a downward curve, suggesting the price may start moving toward the demand zone. The RSI value as of now is 44.25 points while taking resistance from the 14 SMA which is at around 45.93 points, just above the RSI point.
Technical levels –
Support – $3.200 and $3.400
Resistance – $4.000 and $4.400
Disclaimer
The views and opinions stated by the author, or any people named in this article, are for informational purposes only, and they do not establish financial, investment, or other advice. Investing in or trading crypto assets comes with a risk of financial loss.

With a background in journalism, Ritika Sharma has worked with many reputed media firms focusing on general news such as politics and crime. She joined The Coin Republic as a reporter for crypto, and found a great passion for cryptocurrency, Web3, NFTs and other digital assets. She spends a lot of time researching and delving deeper into these concepts around the clock, and is a strong advocate for women in STEM.


