
 Home
Home News
News

- 1 GMT price is testing 200-day EMA as resistance
- 2 GMT price giving indications of an upcoming bull trend
GMT price is currently trading near the beginning of the trend reversal. GMT price has been trading under a severe bear trend for the last couple of days trading firmly under the bear’s influence. Although after making its last lower low GMT token made a small consolidation while also giving a small double-bottom pattern and broke that consolidation range with a strong bullish candle also breaking the previous resistance level. After making an extremely bullish engulfing candle GMT token changed the bearish trend in favour of bulls.

GMT Price is Trading Near the Demand Zone on (1-Day Time frame)
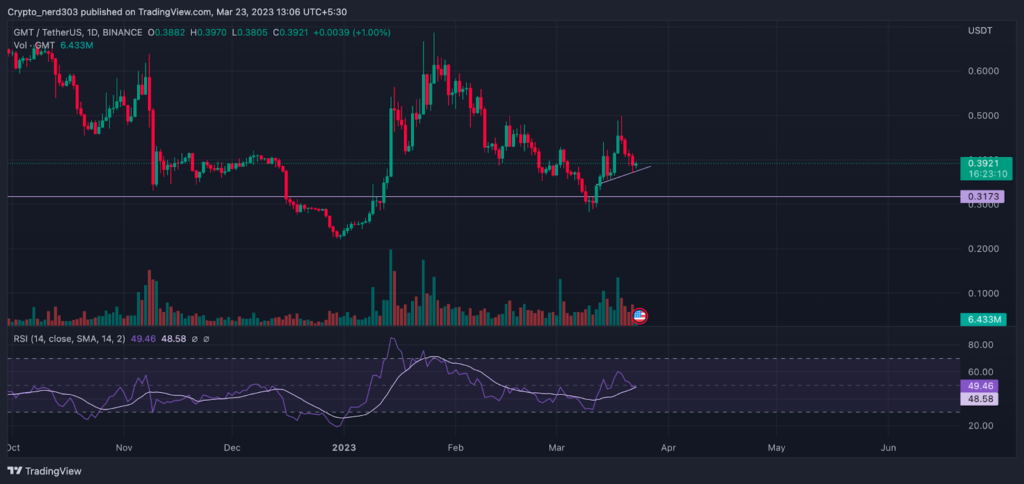
The overall market sentiment is currently trading in the Greed zone with 57 points. Although a slight decline of 3 percent was seen while the market was trading at 62 points. The bears are overpowering the price across all the major cryptocurrency exchange platforms by 50-65 percent as per Coinglass.

Technical Analysis ( On 4 Hour Timeframe)
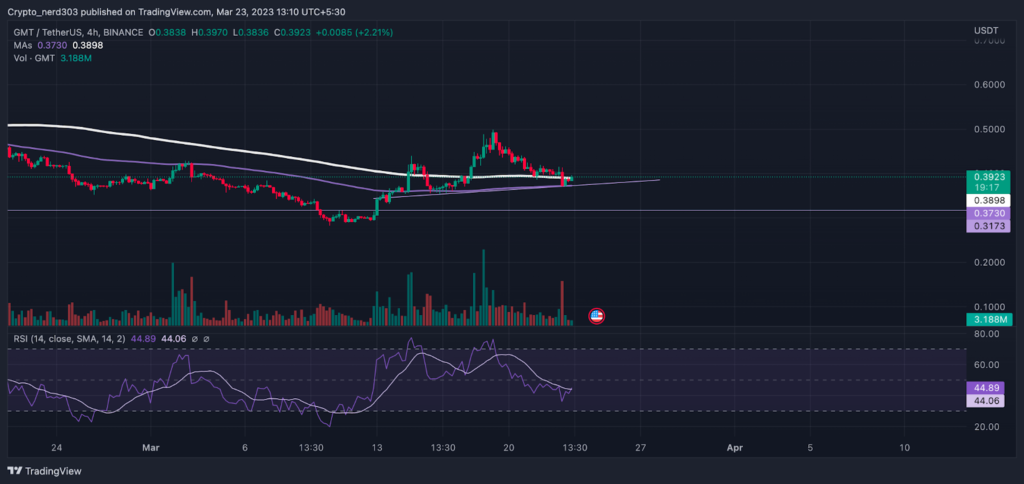
As illustrated in the above chart, GMT price is currently trading just near the demand zone near the 200-day EMA while taking support from the 100-day EMA. After trading below the 200-day EMA for the last couple of months, GMT price recently made an attempt to cross the 200-day EMA in around mid-March but could not succeed. However, after taking support from the 100-day EMA, it was successfully able to breach its resistance. As of now, the GMT price is taking support from the 200-day EMA. If it crosses over it with a strong momentum, chances are that it will give a bullish rally of 21 percent.
The RSI line is currently in the demand zone while the 14 SMA is just above it. The making of an upward curve in the overbought level is suggesting that the RSI line might soon breach its current resistance. The current RSI value is 44.89 percent, just above its 14 SMA which is around 44.06 points.
Conclusion
After taking support from $0.2900, the price started moving in a narrow range. Following that, GMT broke its early resistance at $0.3100 with strong bullish momentum and made a new higher high while gaining 48 percent of its value. The making of a new higher-high and higher-low after, followed by a strong momentum is often seen at the beginning of a new uptrend. The volumes are also showing a sudden spike in the green candles reflecting the ongoing price action.
Technical levels –
Support – $ 0.3898
Resistance – $0.5000
Disclaimer
The views and opinions stated by the author, or any people named in this article, are for informational purposes only, and they do not establish financial, investment, or other advice. Investing in or trading crypto assets comes with a risk of financial loss.

Andrew is a blockchain developer who developed his interest in cryptocurrencies while pursuing his post-graduation major in blockchain development. He is a keen observer of details and shares his passion for writing, along with coding. His backend knowledge about blockchain helps him give a unique perspective to his writing skills, and a reliable craft at explaining the concepts such as blockchain programming, languages and token minting. He also frequently shares technical details and performance indicators of ICOs and IDOs.


