
 Home
Home News
News
- 1 HT price is currently facing increased selling pressure.
- 2 HT price action is rendering long wicks and short bodies.
HT price has been under high selling pressure since February end while trading under the 200-day EMA. The price pattern shows high volatility, making long wicks and short bodies. The candle wicks are also called shadows and represent fluctuation in the price.

HT Price Facing High Volatility in Price Action on (1 Day Time frame)
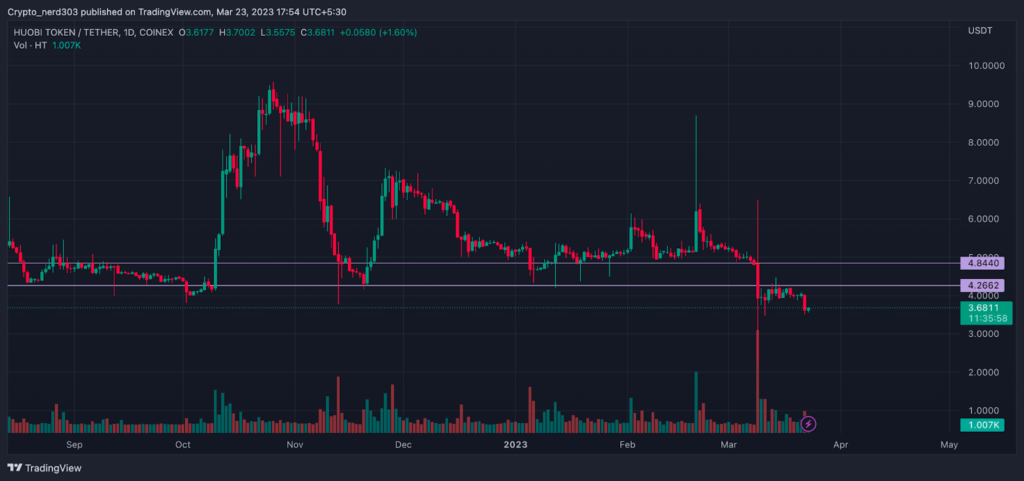
Here, the long wicks in both the short and the long side show the hesitancy and indecision among buyers. Although there is more volatility in the price action, it suggests that a large number of buying and selling is taking place. The price after taking support from $4.00 early in October made a bullish move of over 95 percent. The price made long engulfing candles showing support of the buyers, although after taking rejection from $9.50, Huobi coin depreciated by 58 percent.

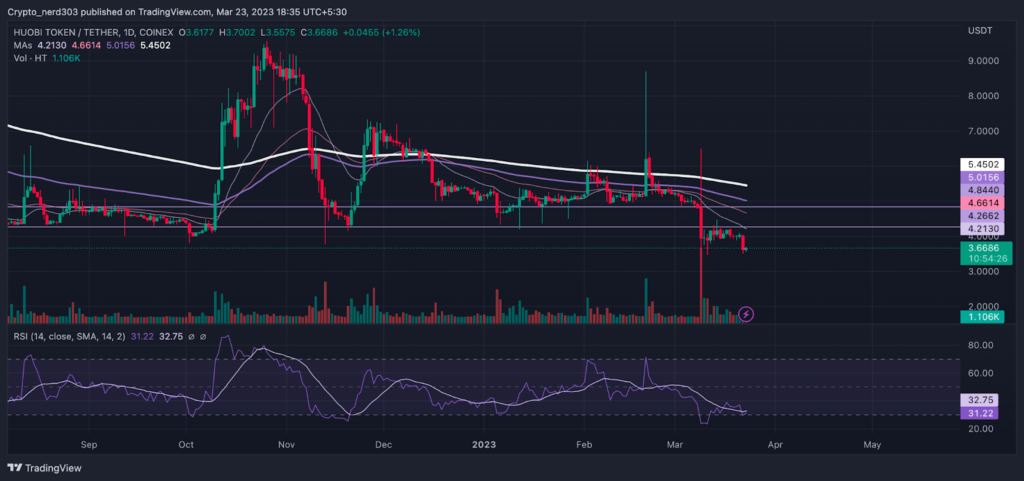
Technical Analysis (1 Day Timeframe)
The overall market sentiments are currently trading under bullish influence according to the Greed and Fear Index. The market is currently trading in the greed zone of around 57 points while seeing a decline of 5 points since last week according to Alternative(dot)me. The bears are currently overpowering the market by 53 percent across all the major cryptocurrency exchange platforms according to Coinglass.
The RSI line is currently trading in the oversold level with 30 points. The current RSI value is 31.00 points while the 14 SMA is providing resistance at around 32.73 points. The upward curve forming around the demand zone is suggesting that the RSI line might soon make a reversal.
Conclusion
After taking support from the previous support level, HT price made a recovery move of 70 percent and reached $6.50. It did not cross its previous resistance level. After taking a downturn of 38 percent, the price started moving within a consolidation range. The price tested the resistance with a strong bullish candle unsuccessfully.
Technical levels –
Support – $3.50
Resistance – $4.20
Disclaimer
The views and opinions stated by the author, or any people named in this article, are for informational purposes only, and they do not establish financial, investment, or other advice. Investing in or trading crypto assets comes with a risk of financial loss.

Andrew is a blockchain developer who developed his interest in cryptocurrencies while pursuing his post-graduation major in blockchain development. He is a keen observer of details and shares his passion for writing, along with coding. His backend knowledge about blockchain helps him give a unique perspective to his writing skills, and a reliable craft at explaining the concepts such as blockchain programming, languages and token minting. He also frequently shares technical details and performance indicators of ICOs and IDOs.


