
 Home
Home News
News

- The Graph price is currently trading below the 50 and 100 Daily Moving Average and can see a bounceback
- Technical indicators of GRT are favoring a weak downside trend.It has seen a drop of 3.8% in the intraday session
The Graph is a protocol which allows developers to easily access blockchain data. It is an indexing and querying protocol which helps developers to create dapps. The Graph is built on top of Ethereum and provides a simple, efficient, and decentralized way to access data on the blockchain. GRT token is used to incentivize node operators to provide indexing and querying services to the network.The Graph’s indexing and querying system is based on a concept called subgraphs. A subgraph is a way to define the data that a dApp needs to access from the blockchain.

The Graph’s decentralized approach to indexing and querying data provides several benefits, including improved scalability, increased security, and greater accessibility. It is built to be modular, allowing developers to easily add new features on their dapps as needed.The Graph has already gained significant adoption in the Ethereum ecosystem and many dapps rely for the information from The Graph.

The Graph has a market cap of $1.3 Billion and is ranked 43rd in the cryptoverse. Volume of the GRT has seen a decline of 40% in the intraday session. Volume to market cap ratio of GRT suggests a consolidated trend in price.
Are Bulls Of GRT Looking For A Push?
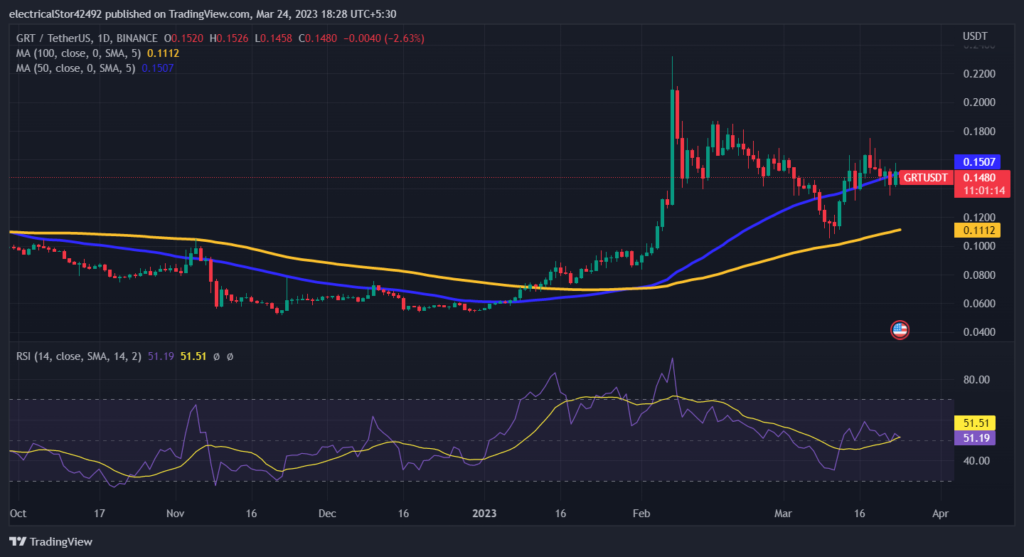
The weekly technical chart of The Graph suggests a consolidated trend in price. On the daily chart it is currently consolidating but can see a strong bounceback in future.It is currently trading near the value of $0.148 with a drop of 2% in the intraday session.Resistance of the The Graph can be seen near $0.2. Meanwhile the support of the asset price can be seen near $0.1. It is currently trading near the 50 DMA and below the 100 DMA. There can be a negative crossover which can push the asset price to a new low in the future.
RSI of the asset price is near 51 suggesting its presence in the neutral zone.There is a zero slope in the RSI suggesting a consolidated trend in price.
Conclusion
The Graph has gained a lot of attention from the investors for a long time. Various analysts are expecting a strong growth in the future.
Technical Levels
Major Support:$0.1
Major Resistance:$0.2
Disclaimer
The views and opinions stated by the author, or any people named in this article, are for informational purposes only, and they do not establish financial, investment, or other advice. Investing in or trading crypto assets comes with a risk of financial loss.

Nancy J. Allen is a crypto enthusiast, with a major in macroeconomics and minor in business statistics. She believes that cryptocurrencies inspire people to be their own banks, and step aside from traditional monetary exchange systems. She is also intrigued by blockchain technology and its functioning. She frequently researches, and posts content on the top altcoins, their theoretical working principles and technical price predictions.


