
 Home
Home News
News

- The current price of AGIX is trading above the Daily Moving Average of 20, 50, 100, 200 days.
- SingularityNET’s current price is $0.4564 with a drop of 5.29% during the last intraday trading session.
- The AGIX/BTC pair is trading at 0.00001665 BTC with a decline of 3.01% in the last 24 hours.
The SingularityNET (AGIX) broke its consolidation phase in Jan 2023. Since then, AGIX was under bullish dominance but the sellers tried to get engaged in its trade. The coin is currently experiencing instability over the daily price chart. AGIX’s surge towards its resistance might get interrupted by the bears. The bulls are trying hard to make it gain some upward momentum.

AGIX is currently trading at $0.4564 with a drop of 5.29% during the last intraday trading session. The bullish dominance might end as the sellers seem to be getting a hold on the AGIX market. The seller might acquire the AGIX market, leading the price to reach the primary support of $0.364. But if the downtrend persists, then the price of the coin may drop to the secondary support of $0.310.

The buyers are also trying to get involved in the roller coaster ride of the AGIX. The bulls might push the price to the primary resistance of $0.545 and it could also reach the secondary resistance of $0.580. As such, the inverters should keep a close watch over the daily price chart of AGIX.
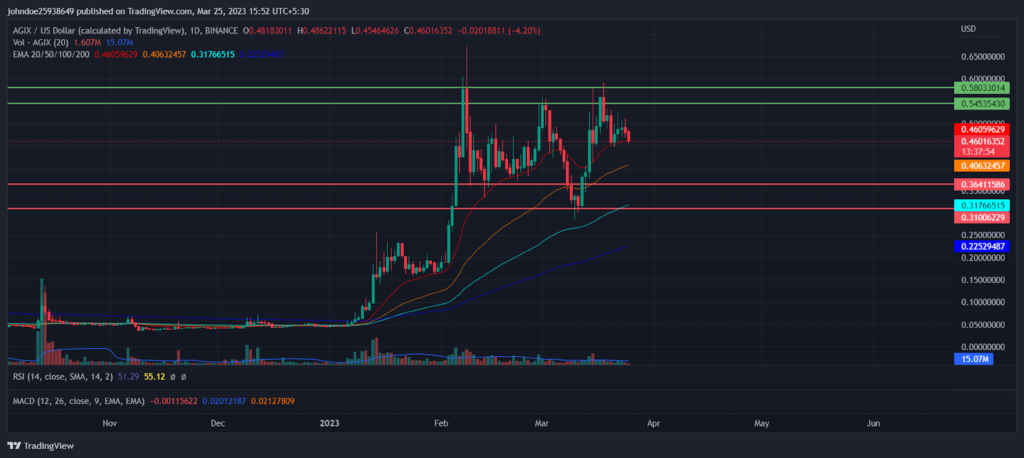
The AGIX volume has decreased by almost 22.35%. The constant decrease in the volume indicates the acquisition of the sellers, and the short-selling pressure over the coin is increasing. AGIX is lagging behind by 20,50,100,200 days of the Daily Moving Average.
The Technical Analysis of AGIX
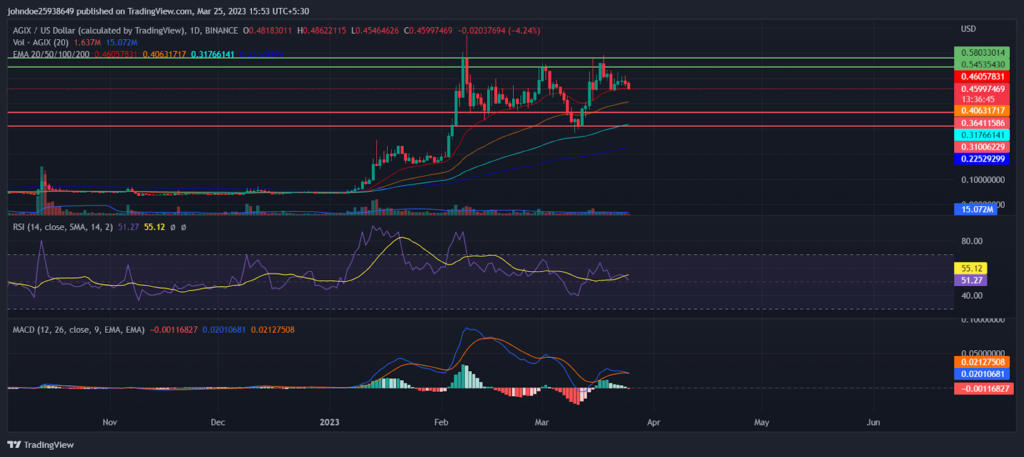
According to the technical indicator, the intersection of the MACD and MACD signal highlight a negative cross. The sellers are getting activated and trying to take the Relative Strength Index (RSI) toward the oversold territory. The RSI’s current value is 51.53, which is lower than its average RSI of 55.14. The RSI seems to return from the over-brought zone toward neutrality. The buyers must act soon as the investors are eagerly waiting for any directional change over the daily price chart.
Conclusion
The current market trend of SingularityNET is bullish. AGIX is facing a roller coaster ride over the daily price chart. Its current price is $0.4564 with a drop of 5.29% during the last intraday trading session. AGIX’s trading volume has decreased, indicating the acquisition of the sellers. The Bulls and Bears are having a tug-of-war over AGIX. The investors are eagerly waiting for any directional change over the daily price chart.
Technical Levels
Support Levels: $0.364 and $0.310
Resistance Levels: $0.545 and $0.580
Disclaimer
The views and opinions stated by the author, or any people named in this article, are for informational ideas only. They do not establish financial, investment, or other advice. Investing in or trading crypto assets comes with a risk of financial loss.
Steve Anderson is an Australian crypto enthusiast. He is a specialist in management and trading for over 5 years. Steve has worked as a crypto trader, he loves learning about decentralisation, understanding the true potential of the blockchain.


