
 Home
Home News
News

- The BAL price is currently trading at $6.95 while seeing a change of 17.84% in 24-hour trading volume.
- The BAL price is observing an increase of 3.00% in the last 24 hours.
- The BAL price may make a breakout in the upcoming days.
The BAL price is currently consolidating between a 10% consolidation range. The consolidation pattern-making at the supply zone suggests that buyers are currently hesitating to support the price at the current levels. This indicates that the sellers can take over the price action at current levels if the price makes a breakdown. If the price gives a breakout above the consolidation, it can give a bullish move.

After making a cup and handle pattern near $5.200, it made a bullish movement of 22%. And after making a small correction, BAL started moving within a consolidation pattern while making a spinning top candle sticks pattern, indicating indecision in the market. However, facing resistance at $7.600, the sellers stepped into the market. It made a bearish move while losing 24% of its value after making a dark cloud cover pattern on the daily timeframe.

The BAL price is currently trading within a consolidation on the (Daily Timeframe)
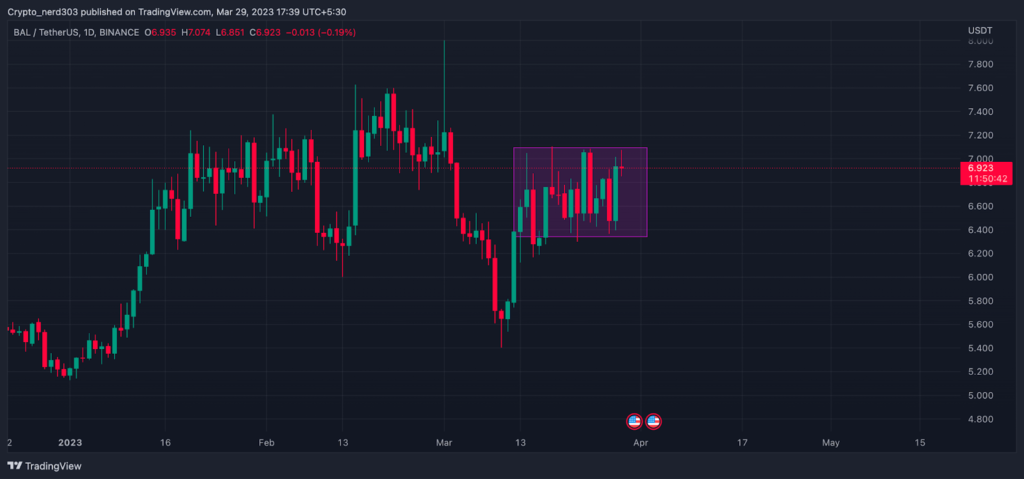
After seeing support at $5.500 and making a bullish hammer pattern (which is often found near the demand zone of a price trend before a reversal), the price made a piercing candlestick pattern while also gaining 30% percent of its value back. The price is currently consolidating in the demand zone.
Technical Analysis ( 1 Day Timeframe )
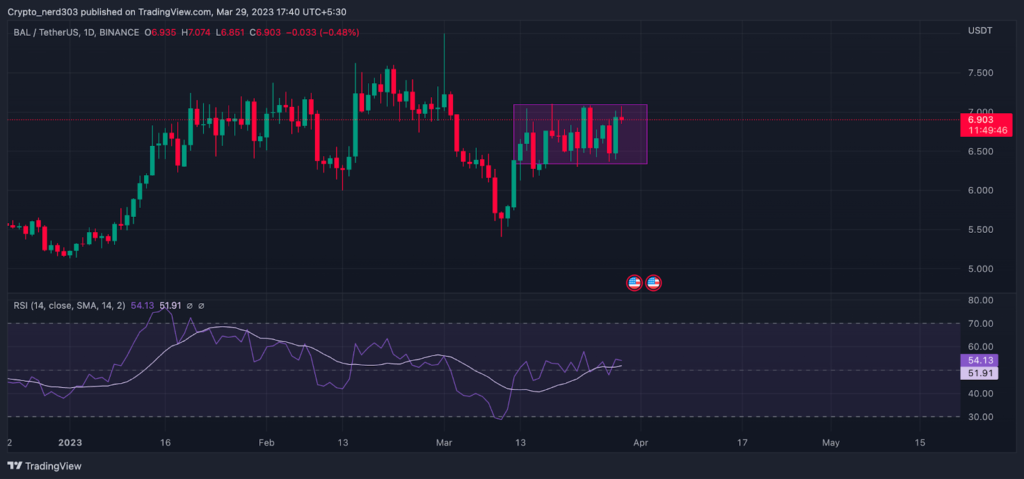
The RSI line is moving just above its median line while consolidating with the price. The current RSI value is 54.13 points while also taking support from the 14 SMA. The making of a downward curve in the RSI line suggests that it might start moving toward the oversold level after crossing below the 14 SMA.
The overall market sentiments are currently in the greed zone near 57 points within the Greed and Fear Index while observing an increase of 7 points since the last month when the market was trading at 50 points, according to the Alternative(dot)me which is a platform that measures the market sentiments from different sources. The GRT price is currently being overwhelmed by the sellers by around 52 to 56%, as per the Coinglass site.
Technical levels –
Support -$0.3908
Resistance – $0.1284
Disclaimer
The views and opinions stated by the author, or any people named in this article, are for informational purposes only, and they do not establish financial, investment, or other advice. Investing in or trading crypto assets comes with a risk of financial loss.

Andrew is a blockchain developer who developed his interest in cryptocurrencies while pursuing his post-graduation major in blockchain development. He is a keen observer of details and shares his passion for writing, along with coding. His backend knowledge about blockchain helps him give a unique perspective to his writing skills, and a reliable craft at explaining the concepts such as blockchain programming, languages and token minting. He also frequently shares technical details and performance indicators of ICOs and IDOs.


