
 Home
Home News
News

- OKB price is currently trading at $42.76 while seeing a change of 1.59% in 24-hour trading volume.
- The OKB price is observing an increase of 0.57% in the last 24 hours.
The OKB crypto price has been trading on a perfect bull trend for the last few months. But recently, the price crossed below the important key averages suggesting that sellers are stepping in the price action. After trading above the 20 EMA, since early November, OKB took a bearish turn and made a breakdown falling below the 20 EMA while losing 24% of its overall value. The price is still trading above the 200 EMA despite the bearish sentiments in the market suggesting that the buyers are still supporting the price.

In the previous analysis, our analysts predicted that the price could make a bearish correction of 12%. Near mid-March when the price was trading near $45.00, our analysts predicted that as the price is trading below the 14 RSI while making a lower high pattern, the price can make a correction. This was proven correct when the price saw rejection from 50 EMA and made a downfall of 12% while taking support from the 100 EMA.

The OKB price taking support from the 200 EMA on (Daily Timeframe)
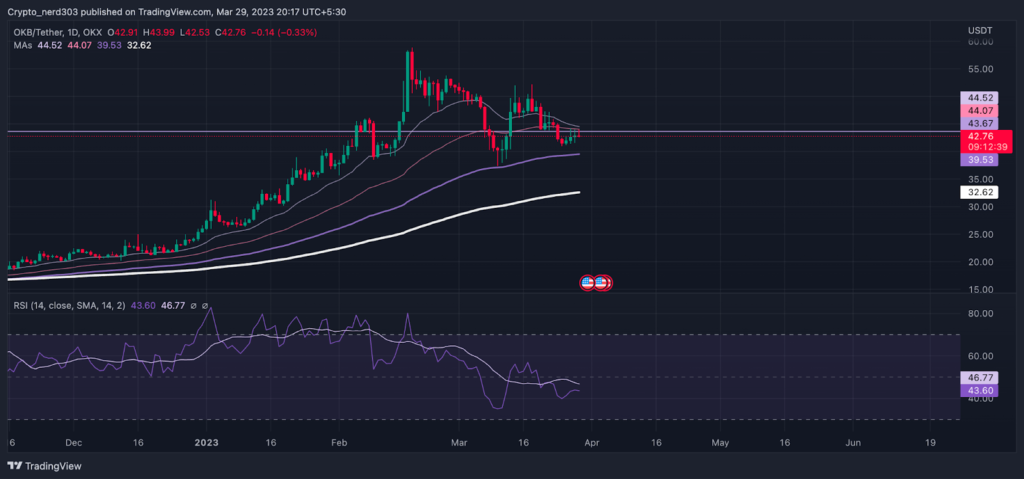
The market sentiments are currently in the greed zone near 57 points within the Greed and Fear Index while observing an increase of 7 points since the last month when the market was trading at 50 points, according to the Alternative(dot)me.
Technical Analysis ( 1 Day Timeframe )
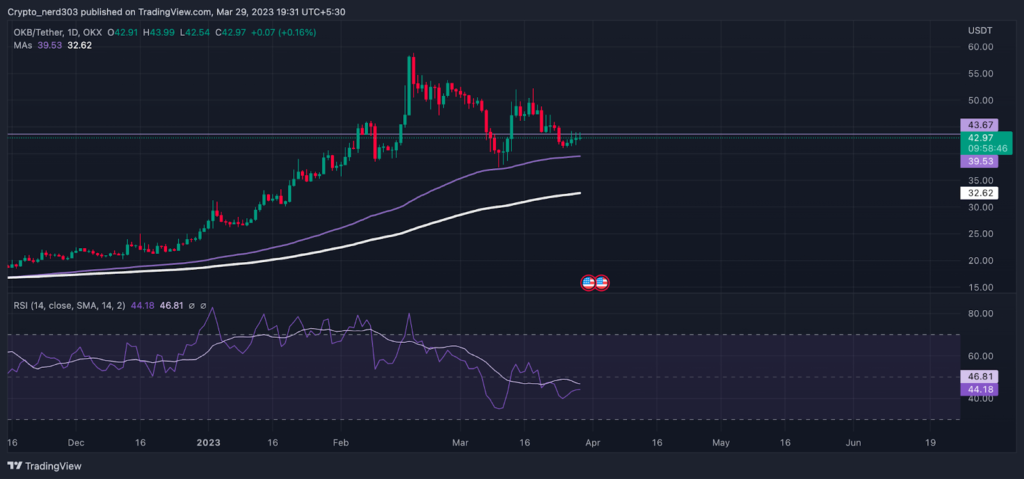
As of now, the OKB price is seeing support from the 100 EMA while trading above the 200 EMA. This suggests that the price may make a bullish reversal from the current price if it makes any strong bullish candlestick pattern, like a bullish engulfing candle or morning star pattern. If the ICP price successfully takes support from the 100 EMA, it can make a bullish rally of 20%. Its recent support level is below the 100 EMA near the price of $35.00.
The RSI line is currently trending above the support zone around 44.18 points while facing resistance from the 14 SMA around 46.81 points which is trading near the median line. The downward trend is suggesting that the RSI line can take a bearish correction before moving toward the oversold levels.
Technical levels –
Support -$39.53
Resistance – $55.00
Disclaimer
The views and opinions stated by the author, or any people named in this article, are for informational purposes only, and they do not establish financial, investment, or other advice. Investing in or trading crypto assets comes with a risk of financial loss.

Nancy J. Allen is a crypto enthusiast, with a major in macroeconomics and minor in business statistics. She believes that cryptocurrencies inspire people to be their own banks, and step aside from traditional monetary exchange systems. She is also intrigued by blockchain technology and its functioning. She frequently researches, and posts content on the top altcoins, their theoretical working principles and technical price predictions.


