
 Home
Home News
News

- 1 DOT shows an upside move of 5.80% revealing a strong bullish trend.
- 2 Polkadot looks to break the triangle pattern in upcoming sessions.
Polkadot price predicts that the coin is the grip of the bulls over the past few sessions. The buyers are ready to lift the coin price and to hold strong on its 20,50 day EMAs. However, the DOT coin is on the verge of breaking the symmetrical triangle pattern which is to look out for. Buyers demand was shown in the last session when an incline move was registered in the price action. Moreover, the “V” shaped recovery from the support mark of $5.00 indicates a steady rise in demand.

Polkadot price is now trading at $6.24, at the time of writing, gaining 5.85% showing bullish moves. Moreover, the price action was supporting bulls because of the reversal action from the support mark. Bulls have consistently accumulated over the past few sessions.

Polkadot Action on the Daily Chart
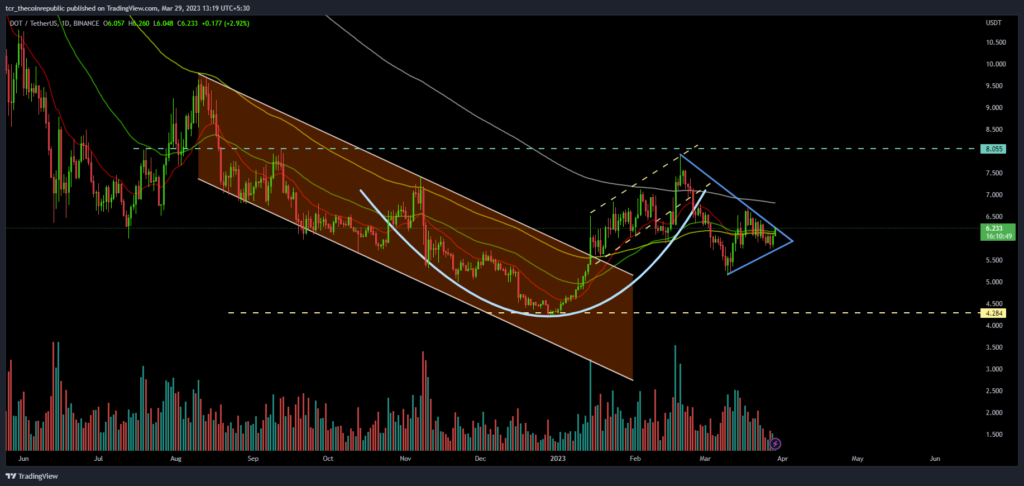
On the daily chart, Polkadot price is at an interesting stage where buyers are trying to pass the range. The bulls are setting eyes on the 200-day EMA to retest, whereas bears are trying to slip below the 20-day EMA to execute a bearish trend.
In the past few sessions, DOT slipped below its significant moving averages and paused near $5.000. Afterward, a strong comeback was seen, leading up the price to sustain its 20 days EMA. As per the Fib levels, the price fetched above its 38.6% level and tried to retest 61.8%, which was at $7.000 in the next sessions.
Moreover, the price action favors bulls because closing the last candle above the upper trendline confirms the steady upside move. Polkadot’s follow-on buying indication encourages investors to pull the price towards the trajectory mark of $7.000. The rise in volume and price put those sellers in trouble who made short positions in past sessions.
DOT shows bullish moves on 4-hour chart
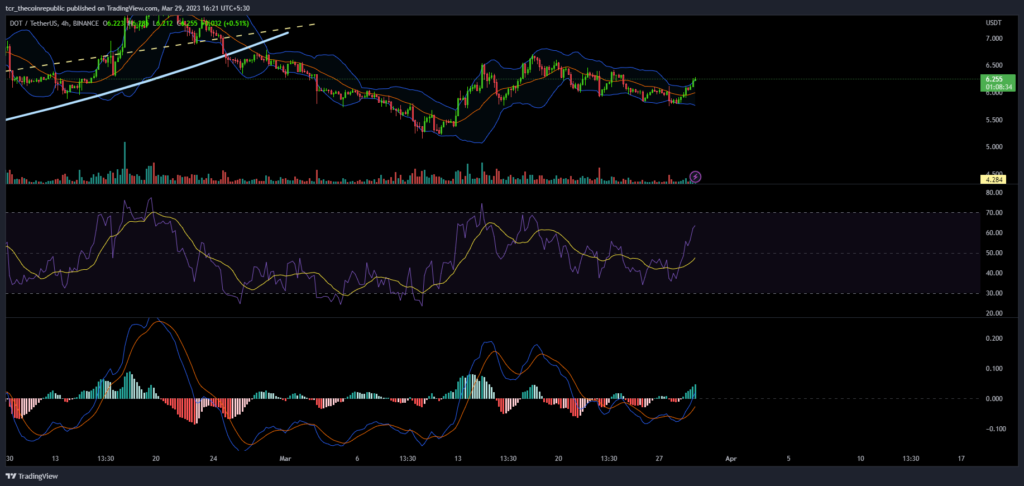
On the short-term chart, Polkadot price showcases bullish moves and breaks the upper Bollinger band with additional confirmation with a trendline breakout. The RSI continues to increase towards the buying zone near 60. The positive crossover in the RSI curve leads to this price rally. Additionally, the price chart indicates a continuation of this surge in the upcoming sessions.
The MACD indicator persists to form green bars revealing the strength of DOT. The bullish crossover was noticed in the last session, and buyers took advantage to break the immediate hurdle.
Technical Levels
Support levels: $5.880 and $5.550
Resistance Levels:$7.000
Conclusion:
Polkadot price is ready for more upside moves towards the immediate hurdle of the 200-day EMA. The recent price reversal from the demand zone near $5.000 could fuel more highs.
Disclaimer
The views and opinions stated by the author, or any people named in this article, are for informational ideas only and do not establish financial, investment, or other advice. Investing in or trading crypto or stock comes with a risk of financial loss.

Nancy J. Allen is a crypto enthusiast, with a major in macroeconomics and minor in business statistics. She believes that cryptocurrencies inspire people to be their own banks, and step aside from traditional monetary exchange systems. She is also intrigued by blockchain technology and its functioning. She frequently researches, and posts content on the top altcoins, their theoretical working principles and technical price predictions.


