
 Home
Home News
News

- Polkadot is currently trading at $6.28 (press time) with an increase of 0.98% intraday.
- The 24-hour low for DOT was $6.16 and the 24-hour high was $6.39.
- The current Polkadot price is between the 50-, and 200-Day EMAs.
The DOT/BTC pair was trading at 0.0002205 BTC with a dip of 0.43% over the intraday trading session.

Polkadot price prediction suggests that it is currently in an uptrend after testing its primary support of $6.06. DOT price fell by 70.53% last year which indicates that the year 2022 was a rough year. Sellers dominated DOT price and due to this, the token fell below its primary support near the end of 2022 and remained there. This shows that heavy short-selling happened in 2022.

DOT price made its new 52-week low at the end of the year. However, from the start of 2023, the token was moving upwards because of accumulating buyers helping the token break its primary support and resistance and reaching its secondary resistance of $7.92. However, after testing its secondary resistance, sellers pushed DOT token into a downtrend as seen on the daily time-frame chart.
However, the formation of the morning star candlestick pattern after the prior downtrend over the daily trading chart might be the cause of the current downtrend. This may be the sign of a potential recovery in the token price over the daily trading chart.
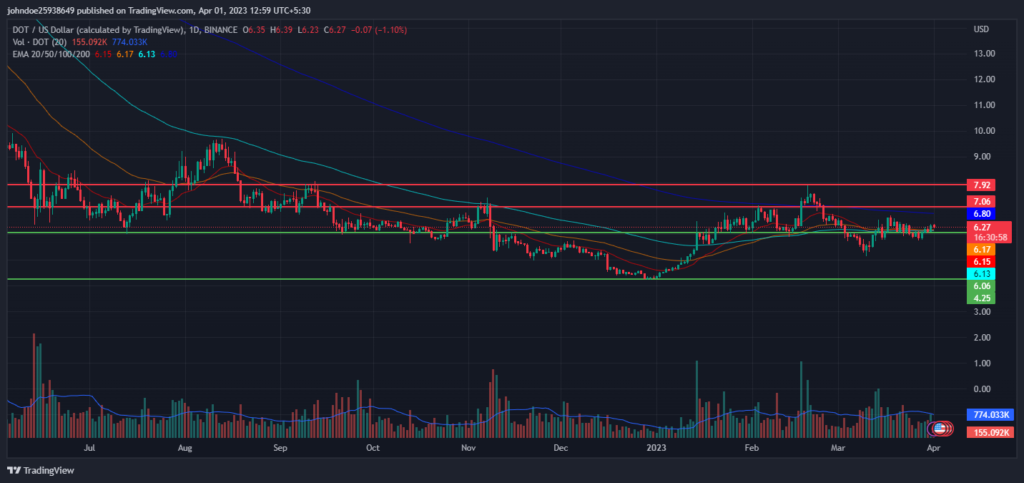
The trading volume of the coin increased by 14.84% in the last 24 hours, meaning that buying in the market increased, indicating bullish intent.
Polkadot Price Technical Analysis
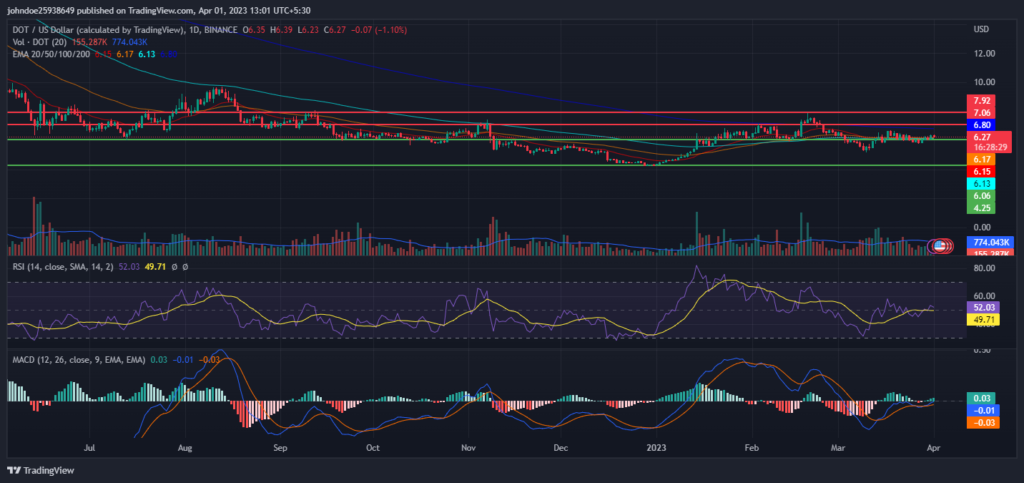
The Relative Strength Index (RSI) decreased in the overbought zone and showed a negative crossover over the daily time frame chart. The sellers are in majority and are pushing DOT downwards. This shows the weakness of the current bullish trend. The current value of RSI is 52.03, which is above the average RSI value of 49.71.
However, the MACD and the signal line are increasing and have shown a positive crossover on the daily chart.
Conclusion
Polkadot price prediction suggests that it is currently in an uptrend after testing its primary support of $6.06. DOT price fell by 70.53% in 2022. However, since the start of 2023, DOT token was seeking stability in the market. The increase in the trading volume shows the positive market sentiment toward the DOT token.
However, the RSI and MACD are giving contradicting signals for the DOT token. RSI is decreasing showing weakness in the current bullish trend but on the other hand, MACD is increasing and has shown a positive crossover which shows strength in the current bullish trend. Traders should take caution before entering the market.
Technical Levels
Resistance level- $7.06 and $7.92
Support level- $6.06 and $4.25
Disclaimer
The views and opinions stated by the author, or any people named in this article, are for informational purposes only, and they do not establish financial, investment, or other advice. Investing in or trading crypto assets comes with a risk of financial loss.

With a background in journalism, Ritika Sharma has worked with many reputed media firms focusing on general news such as politics and crime. She joined The Coin Republic as a reporter for crypto, and found a great passion for cryptocurrency, Web3, NFTs and other digital assets. She spends a lot of time researching and delving deeper into these concepts around the clock, and is a strong advocate for women in STEM.


