
 Home
Home News
News

- 1 The LTC price is currently trading at $79.16 while seeing a change of 12% in 24-hour trading volume.
- 2 The LTC price is observing a decline of 1.45% in the last 24 hours.
The LTC price is currently trading on a bullish trend making higher highs and lows in the last 7 months. Though despite the bullish sentiments the LTC price is yet to make a breakout successfully above the 200 EMA. Litecoin is seeing a strong surge in active users recently which indicates that it may create an impact on its price and investors’ sentiments.

The overall technical indicators are currently favoring the bulls after trading under bear control. The price is currently attempting to change its trend with the bull’s support. If the price gains support from buyers near its recent support level it may continue its uptrend eventually breaking out of the bear’s grasp over it.

Steady Increase TVL and Active Users in the LTC coin
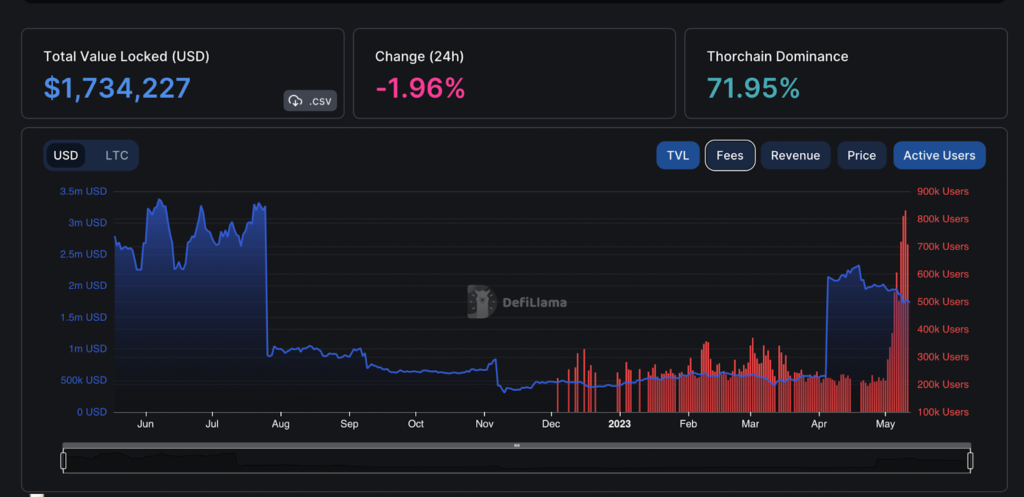
The TVL value of the token indicates that there is a recent increase in the confidence of the investors while the platform is also seeing a positive surge in active users within the past few months. Recently Lite count reached 800K users after breaking its resistance near the 300k level. Hence the long-term view of LTC is price projects a bullish perspective.
The Total Value Locked of Litecoin is also observing an increase since mid-April. Its current value is $1.734M.
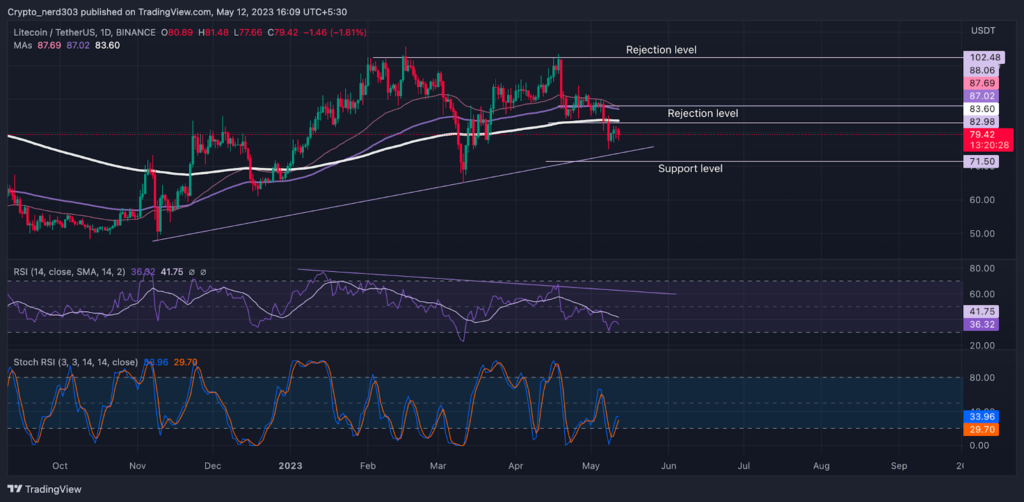
At present, the LTC price is currently trading below all the major key 20/50/100/200 indicators, According to the historical price action the price has constantly crossed the EMI lines which suggests that the current price is not respecting it.
The RSI line is taking rejection from the 14 SMA at present indicating that the price may also take a bearish correction. The current RSI value is 36.32 points and the 14 SMA is providing resistance around 41.75 points. The RSI line is making a lower high and lower low against the bullish movements of the price action.
The stochastic RSI is also taking the RSI’s lead. It has already made a bearish crossover between the %K and %D lines. The current value of the %K line is 33.96 points and the %D line is 41.75 points.
Conclusion
According to analysis, the major trend for LTC price is bullish. As of now, the LTC price is taking a bearish correction from the 200 EMA. The price is predicted to take a downturn of 6% before making a bullish reversal in the upcoming days.
Technical levels –
Support –$71.0 and $75.0
Resistance – $102.00
Disclaimer
The views and opinions stated by the author, or any people named in this article, are for informational purposes only, and they do not establish financial, investment, or other advice. Investing in or trading crypto assets comes with a risk of financial loss.

Andrew is a blockchain developer who developed his interest in cryptocurrencies while pursuing his post-graduation major in blockchain development. He is a keen observer of details and shares his passion for writing, along with coding. His backend knowledge about blockchain helps him give a unique perspective to his writing skills, and a reliable craft at explaining the concepts such as blockchain programming, languages and token minting. He also frequently shares technical details and performance indicators of ICOs and IDOs.


