
 Home
Home News
News
- 1 BCH’s price is currently trading at $114.7 while seeing a change of 52% in 24-hour trading volume.
- 2 Bitcoin Cash is down by 2.48% in the last 24 hours.
BCH’s price is making an attempt to break the bear’s hold over it. The price of BCH has been trading under a severe downtrend for the past few months. Recently, after gaining buyers’ support from $90.00 near last November the price started making higher high and higher low patterns.

Though the sellers have a strong command over the price action. BCH’s price made a bearish red candle near the support level of the trendline showing the seller’s attempt to recapture the trend. However presently, the buyers are defending the support zone.

A Difference in Price and TVL of BCH Token
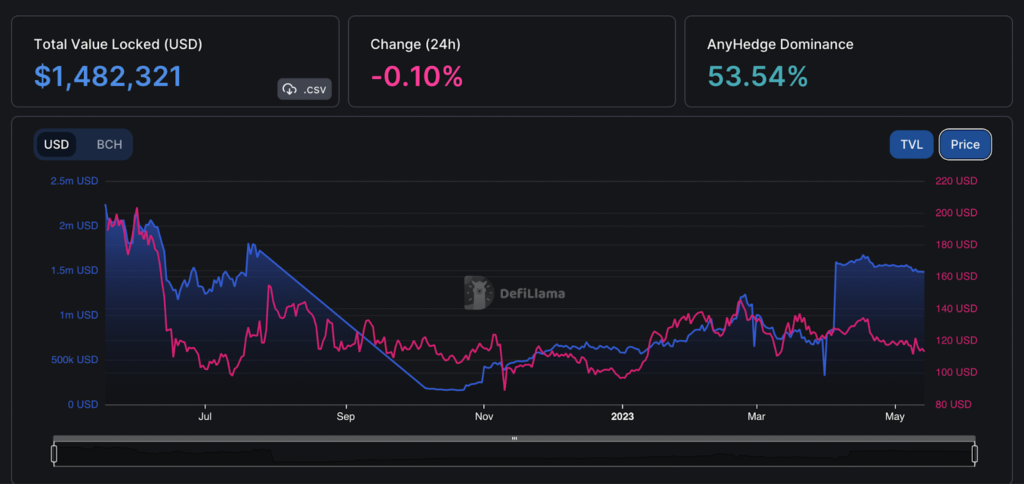
The TVL (Total Value Locked) is seeing a significant increase since early April after its sharp decline near last October. The increment in TVL value represents the increasing confidence of the buyers. The present TVL of BCH is 1.142M, it is observing a change of -0.10% within the last 24 hours. In comparison to TVL, the price of BCH is trading near its previous level which reflects a lack of trading activity.
The Sentiment of Investors and Social Engagement Rate
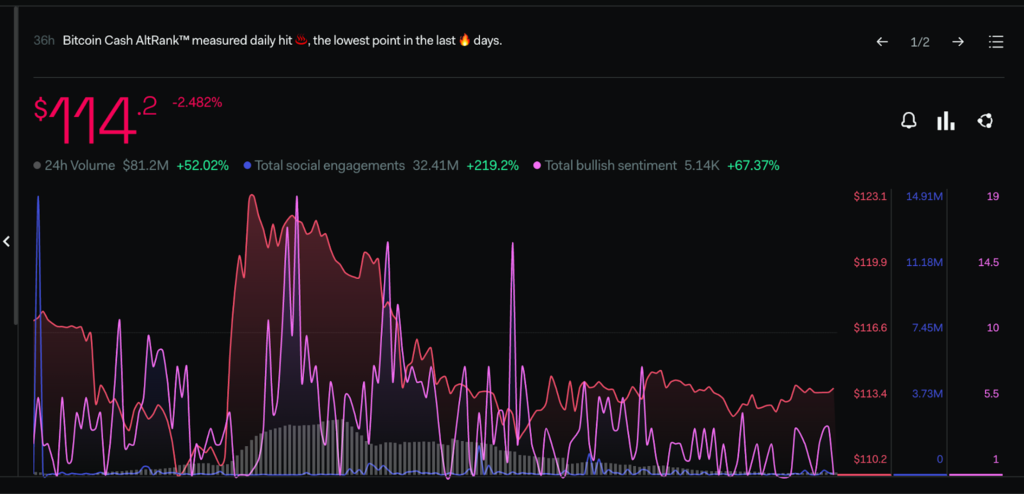
The investor’s sentiments are presently bullish. Total bullish sentiment metrics provided by LunarCrush are seeing a surge of 67.37% whereas Social engagements have observed a critical rise of 219.2% within the past few weeks.
The change in these values indicates that investors are getting more engaged in BCH coin across various social media platforms and the bullish sentiments are also raising among the buyers.
Technical Analysis ( 1 Day Timeframe )
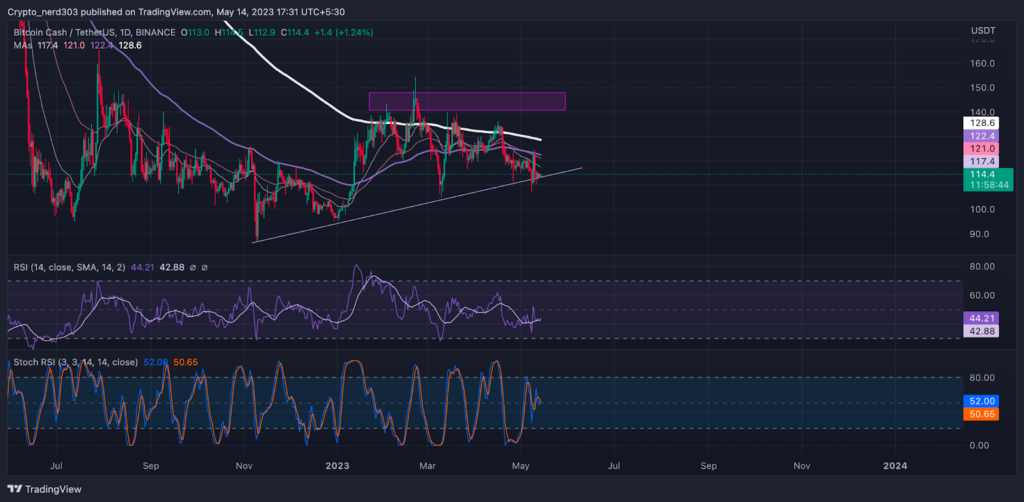
Presently the BCH price is consolidating near the demand zone despise sellers’ attempts to plunge the price down further. It is attempting to make a bullish rebound from the trend line at $114.
The RSI line has been making a lower high and low pattern below 14 SMA as of late. The current value of RSI is 44.21 points whereas the 14 SMA is providing resistance to it at 42.88 points.
The stochastic RSI seems to be taking a bearish crossover from 50 points. The current value of stochastic RSI is 52.00 points. The %K line may soon give a negative interception to the %D line.
Technical levels –
Support –$110.0 and $100.0
Resistance – $150.0 and $130.0
Conclusion
According to the historical price action, it can be analyzed that the price of BCH is attempting to make a rebound from the trend line and investors’ sentiments are positive regarding it. Despite the bullish sentiments of the investors the price is yet to escape the danger zone.
Disclaimer
The views and opinions stated by the author, or any people named in this article, are for informational purposes only, and they do not establish financial, investment, or other advice. Investing in or trading crypto assets comes with a risk of financial loss.

Nancy J. Allen is a crypto enthusiast, with a major in macroeconomics and minor in business statistics. She believes that cryptocurrencies inspire people to be their own banks, and step aside from traditional monetary exchange systems. She is also intrigued by blockchain technology and its functioning. She frequently researches, and posts content on the top altcoins, their theoretical working principles and technical price predictions.


