
 Home
Home News
News

- 1 SHIBA’s price is currently trading at $0.0000084 with a 5.15% drop in the 24-hour trading volume.
- 2 The price of SHIBA is seeing a decline of 3.25% in the last 24 hours.
The SHIBA price is observing significant selling pressure with a decline of 22% within the last 7 days. Though it is reaching an important support level on a daily timeframe hence the price may take a bullish diversion with bulls support. The buyers have been defending the demand zone for the past 15 months which creates an adequate probability that it may make a positive comeback in the near future.

The technical indicators are at present in favor of bears. The Oscillators are taking a reversal from the supply zone whereas the EMA levels are providing a severe resistance to the price. However, observing historical and current price action the buyers are not respecting the EMAs and SMA’s.

The current price of SHIBA is $0.0000084, Its Market cap is $4.97B.
YouTube Volume and Bearish Sentiments in SHIBA Token
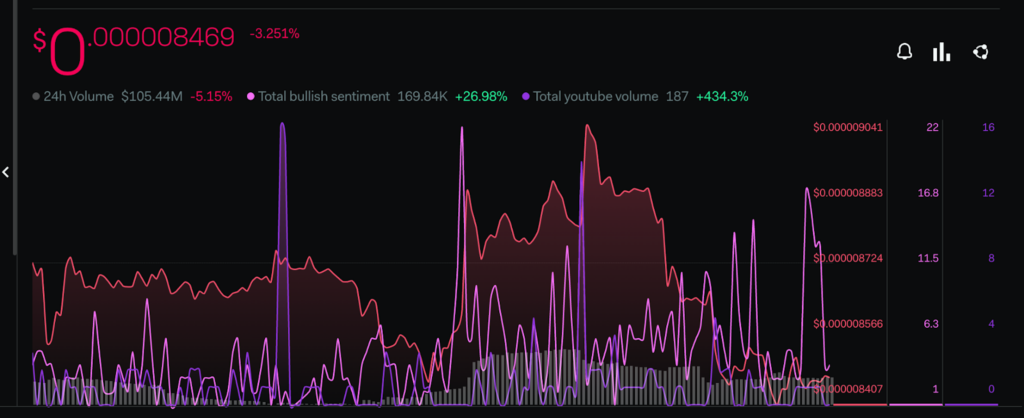
The investor’s sentiments are taking a bullish turn at present. The total bullish sentiment is currently observing an increase of 26.98% within the last week. The increasing bullish sentiment of the buyers indicates that the investors are already gearing up for the possible bullish reversal of the token.
There is also a significant increment in the Total YouTube Volume of the SHIBA INU token, The YouTube Volume has surged by 434.3% which suggests that there is an increasing awareness among the buyers according to the LunarCrush. These metrics suggest that even though sellers are prominent in the market the buyers may soon take the control back, which is also in accordance with the price action.
Technical Analysis of SHIBA Price
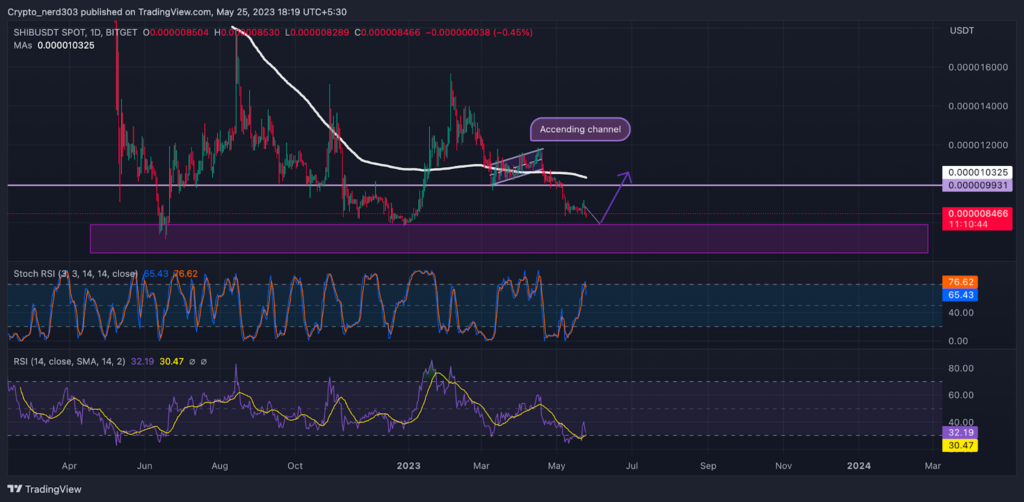
Presently, the price of SHIBA is trading under a short consolidation near its recent support level of around $0.00000093 after making a red engulfing candle.
The RSI line is taking a negative reversal below the median line after crossing over 14 SMA. The current value of the RSI line is 32.19 points whereas it takes the 14 SMA is around 30.47 points.
The stochastic RSI is making is facing a rejection from 70.00 points near oversold level. The %K line is taking the lead after giving a negative interception to the %D line. The current value of the Stochestic RSI is 65.43 points.
Conclusion
The price of SHIBA has been trading with a bearish influence for the past few weeks. Presently it is currently trading near its previous support zone from which the price has taken a positive reversal multiple times as per historical price action.
Technical levels
Support – $0.0000080
Resistance – $0.0000120
Disclaimer
The views and opinions stated by the author, or any people named in this article, are for informational purposes only and do not establish financial, investment, or other advice. Investing in or trading crypto assets comes with a risk of financial loss.

Andrew is a blockchain developer who developed his interest in cryptocurrencies while pursuing his post-graduation major in blockchain development. He is a keen observer of details and shares his passion for writing, along with coding. His backend knowledge about blockchain helps him give a unique perspective to his writing skills, and a reliable craft at explaining the concepts such as blockchain programming, languages and token minting. He also frequently shares technical details and performance indicators of ICOs and IDOs.


