
 Home
Home News
News
- 1 SHIBA’s price is currently trading at $0.0000087 with a 0.70% increase in the 24-hour trading volume.
- 2 The price of SHIBA is seeing a decline of 3.1% in the last 24 hours.
SHIBA price has been trading under significant selling pressure for the past few months daily. After taking multiple rejections from the 200 EMA, the price of Shiba INU declined by 25%. The buyers have been defending the demand zone for the past 15 months.

The technical indicators present a contrasting view regarding the near future. The RSI line and price action suggest that the price may take a bullish turn. whereas the Stochastic RSI is trading near the overbought zone, EMA levels are providing severe resistance to the price.

The current price of SHIBA is $0.0000087, its market capitalization is observing a slight surge, and the present value is around $4.97 Billion.
An Increase in Spam Volume and Bearish Sentiments in SHIBA Token
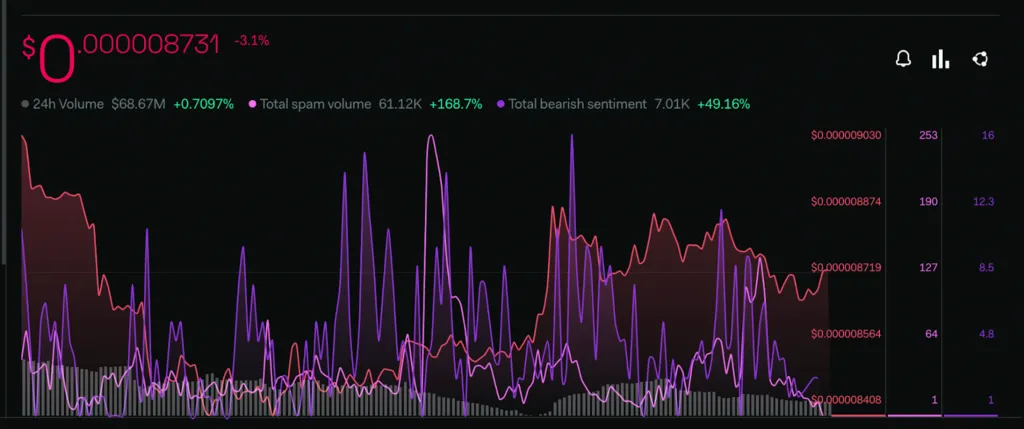
There is an increase in the negative sentiments of investors across various social media platforms. The total bearish sentiment metrics have surged by 49.16% within the last week. The sentiment metrics indicate that the buyers are not supporting the token’s possible bullish reversal.
There is also a significant increment in the Spam Volume of the SHIBA INU token, The Spam Volume surged by 168.7% which presents a foreboding view regarding the future direction of price trend as per the metrics given by LunarCrush.
Technical Analysis of SHIBA Price
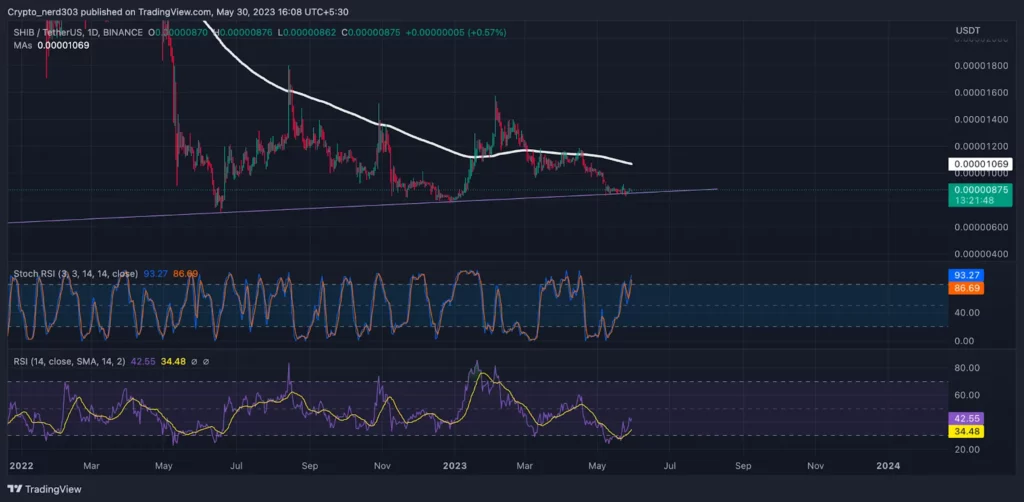
Presently, the price of SHIBA is making a short consolidation phase near the demand level as was indicated in the previous analysis after making a red engulfing candle.
The RSI line is making a higher high and low pattern after crossing over 14 SMA. The current value of the RSI line is 42.55 points whereas the 14 SMA is around 34.48 points.
On the contrary, stochastic RSI is taking a critical rejection from 70.00 points near oversold level. The %K line suggests that it may soon give a negative interception to the %D line. The current value of the Stochastic RSI is 93.27 points.
Conclusion
The price of SHIBA has been trading with significant selling pressure, though it is indicating a positive reversal. According to the analysis, the price is presently reaching an important support level which may encourage the buyers to propel the price up and take a bullish diversion. However, observing historical and current price action, buyers do not respect the EMAs and SMA’s.
Technical levels
Support – $0.0000080
Resistance – $0.0000120
Disclaimer
The views and opinions stated by the author, or any people named in this article, are for informational purposes only and do not establish financial, investment, or other advice. Investing in or trading crypto assets comes with a risk of financial loss.

Andrew is a blockchain developer who developed his interest in cryptocurrencies while pursuing his post-graduation major in blockchain development. He is a keen observer of details and shares his passion for writing, along with coding. His backend knowledge about blockchain helps him give a unique perspective to his writing skills, and a reliable craft at explaining the concepts such as blockchain programming, languages and token minting. He also frequently shares technical details and performance indicators of ICOs and IDOs.


