
 Home
Home News
News
- 1 XDC price is currently trading at $0.0383 while seeing a change of 272% in 24-hour trading volume.
- 2 The XDC price chart shows an increase of 8% in the last 24 hours.
The price action in XDC’s price suggests that the bulls are not ready to surrender their control over the price at present. The price recently made a breakout through the 200 EMA with an extremely bullish engulfing candle on the daily timeframe. The price of XED recovered more than 20% of its overall value.

The price action suggests that the buyers may get encouraged by the bullish breakout which is reflected by the long candlesticks patterns. The engulfing candles often represent the confidence of the buyers in the token.

Recently, the price observed a strong selling pressure after taking rejection from $0.04500 in the token and declined by 32% within the next few weeks.
XDC Price Made a Bullish Breakout on the (Daily Time frame)
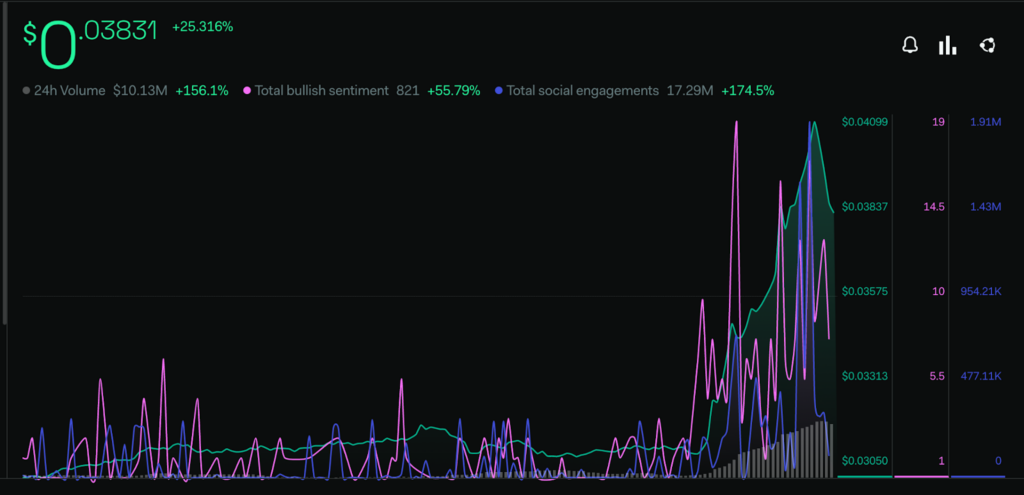
The investor’s sentiment regarding the Ripple token is positive, there is a sharp increase of 55.79% in the bullish sentiments as per the metrics provided by LunarCrush. XDC coin also seems to be gaining attention of the prospective buyers across various media platforms, The Total Social Mention rate has surged significantly within the last week by 174.5% within the last few days.
A Surge in TVL of XDC Token
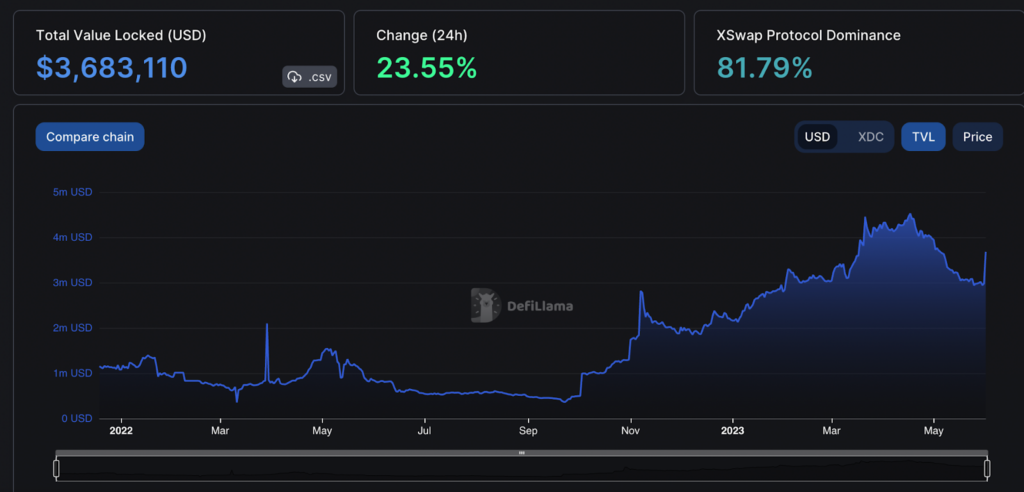
The TVL (Total Value Locked) has increased substantially since last September. It attained its all-time high near 4.52 Million USD. After a short decline in TVL, the buyers are regaining interest in the token. The present TVL of XDC is $3.68 Million, it is observing a change of 23.55% within the last 24 hours.
In the previous analysis, it was estimated that XDC price can see a further increase in its value before the reversal of around 12% as per the oscillators and price action.
Technical Analysis (1 Day Timeframe )
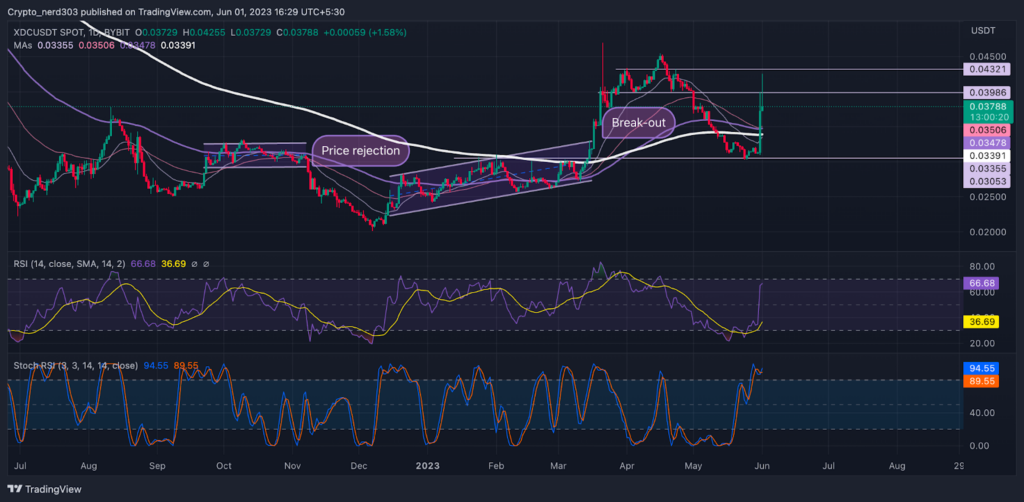
At present, the oscillators are suggesting a negative reversal on the daily timeframe.
The RSI line has taken a sharp divergence from the 14 SMA line reaching the overbought level on the daily timeframe. The current value of the RSI is 58.41 points seeing resistance from the 14 SMA at 36.69 points.
The stochastic RSI is trading near the overbought zone, It is trading at 94.54 points near the overbought zone.
Conclusion
According to analysts, the investors are currently showing great optimism regarding XDC price though the technical indicators are bearish.
Technical levels –
Support -$110.0
Resistance – $140.0
Disclaimer
The views and opinions stated by the author, or any people named in this article, are for informational purposes only, and they do not establish financial, investment, or other advice. Investing in or trading crypto assets comes with a risk of financial loss.

Andrew is a blockchain developer who developed his interest in cryptocurrencies while pursuing his post-graduation major in blockchain development. He is a keen observer of details and shares his passion for writing, along with coding. His backend knowledge about blockchain helps him give a unique perspective to his writing skills, and a reliable craft at explaining the concepts such as blockchain programming, languages and token minting. He also frequently shares technical details and performance indicators of ICOs and IDOs.


