
 Home
Home News
News

- 1 AGIX price is currently trading at $0.295 while seeing a 3.98% uptick in the 24-hour trading volume.
- 2 AGIX’s price recorded a decline of 4.75% in the last 24 hours.
AGIX price is currently making a downward curve implying that the price of the SingulartyNET coin might be gearing up for a bearish correction. The price has been making constant attempts to breach above $0.3200 without success which indicates that presently the buyers are refusing to support above this level.

In the smaller time frame, the price is consolidating between 100 and 200 EMA, making an uptrend. However, in the longer term timeframe, the price indicates that it might prefer to make a correction before taking a positive pullback.

The current value of the AGIX token is $0.295 and it has a market cap of $360.46 Million. According to market capitalization, SingulartyNET is in the 99th rank.
AGIX Price Is Trading On a Bull Trend In Daily Timeframe
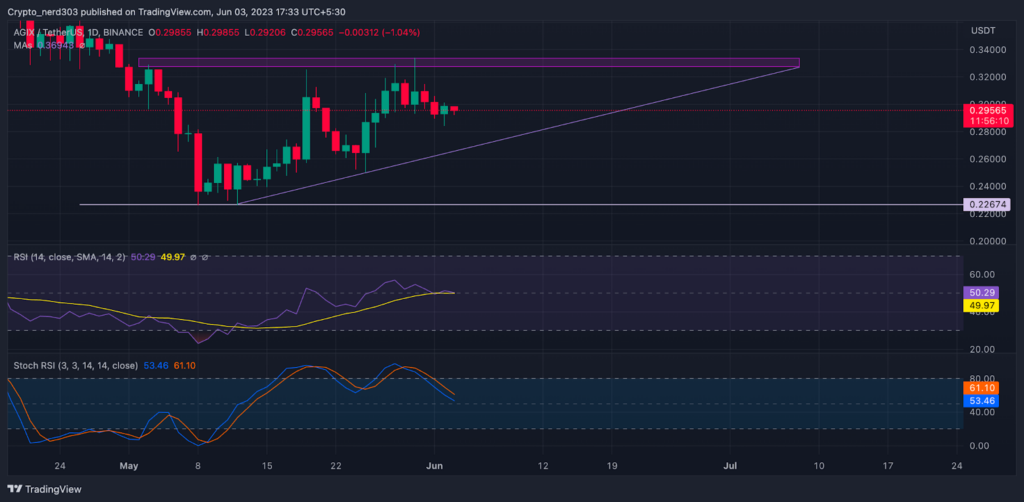
AGIX’s price declined by 11% after making a sharp reversal from the $0.3300 price which is proving to be a challenging barrier to the buyers. It is predicted to see a further decline of more than 8% if the buyers fail to defend their recent support zone.
AGIX Price Observes an Appreciation In The Total Bullish Sentiments
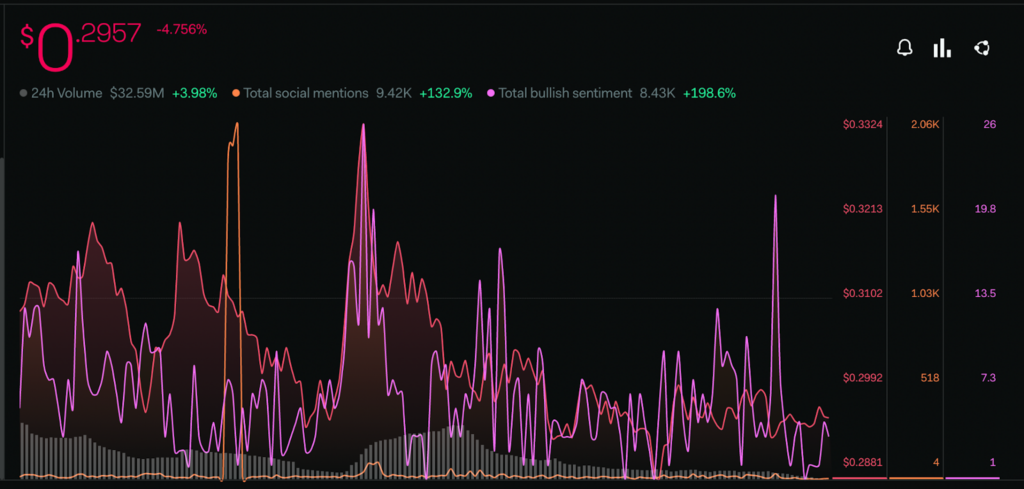
The investor’s sentiments regarding the price have surged dramatically within the past few weeks. Total Bullish sentiment metrics have increased by 198.8% conveying the buyers growing interest in the token within the past week whereas there is a positive incline in the total social mention level of 132.9% which exhibits an increase in the social activity of prospective buyers in the community.
Technical Analysis ( 4Hr Time Frame )
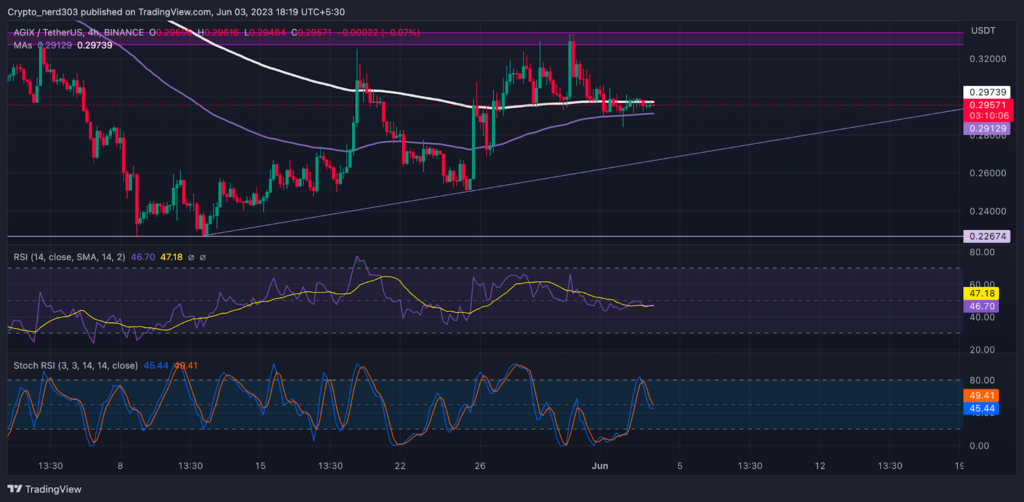
Both RSI and stochastic oscillators are at present moving near the median line on the daily timeframe.
The RSI line is at 46.70 points at present, attempting to cross above the 14 SMA which is trading at 47.18 points. The buyers might prefer to wait for a positive crossover before deciding the direction of a reversal.
The stochastic RSI is also moving with the RSI line. The %K line indicates that it may soon give a positive interception to the %D line. The present value of stochastic RSI is 45.44 points.
Conclusion
Though overall market sentiment is bullish despite a slight decline in the last few days. The bulls can take control back of the market after reaching the $0.2500 price point. Observing the historical price action it can be estimated that the buyers support the bull trend.
Technical levels –
Support -$0.2800
Resistance – $0.3200
Disclaimer
The views and opinions stated by the author, or any people named in this article, are for informational purposes only and do not establish financial, investment, or other advice. Investing in or trading crypto assets comes with a risk of financial loss.

With a background in journalism, Ritika Sharma has worked with many reputed media firms focusing on general news such as politics and crime. She joined The Coin Republic as a reporter for crypto, and found a great passion for cryptocurrency, Web3, NFTs and other digital assets. She spends a lot of time researching and delving deeper into these concepts around the clock, and is a strong advocate for women in STEM.


