
 Home
Home News
News

- 1 FTX is currently trading at $0.9513, with an increase of +1.97% during the intraday session.
- 2 FTT price trades below 20,50,100, and 200-day EMAs.
- 3 The year-to-date return of FTT is 13.01%, while three-month return is -24.98%.
FTT, a native cryptocurrency of the crypto derivative trading platform FTX was launched in the year 2019. FTX filed for Chapter 11 bankruptcy protection in the United States on Nov 11,2022.

FTX price is in strong bearish momentum breaching the March lows, and is headed toward the yearly low of $0.8062 level. FTT price is currently trading below the $1 level. The price is in the consolidation zone ranging between $1 and $0.93. The bullish rally for FTT price began at the start of 2023, which led to the creation of annual highs of $3.1 level on 8 February. The move was corrected by the bears after the price received a strong rejection from the $3.1 level.

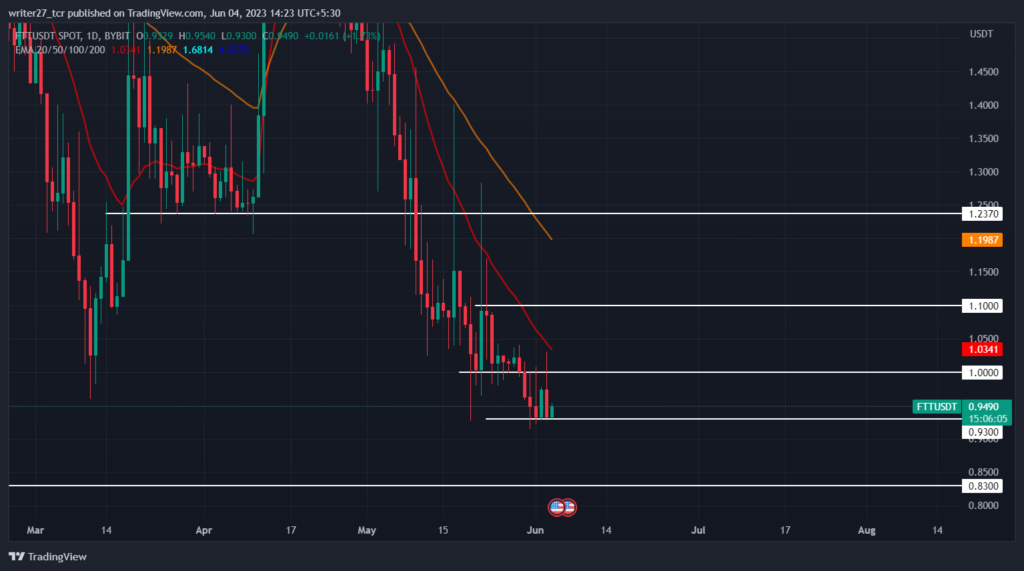
After correction, the FTT price formed support at the $1 level in March and regained bullish momentum to retest the annual highs, but the move was halted as the price received a rejection from the $2.90 level. Since then, FTT Price has been in a strong bearish momentum.
If the bears can break the recent support of the $0.93 level, there is a possibility that the price might fall straight to the $0.83 support level. For a bullish confirmation, FTT price needs to rise above the $1.60 level.
Will FTX Come Back to LIfe?
The latest court filing in the FTX bankruptcy case suggests that the company is working on a plan to reboot operations. Chief executive officer John J. Ray has been working on a reboot of the exchange material with the aim of repaying investors.
There are reports stating that the company has retrieved and uncovered $5.5 billion in liquid assets. Ray is also working with the creditors on a potential revival plan.
Will FTT Price Reach Yearly Lows?
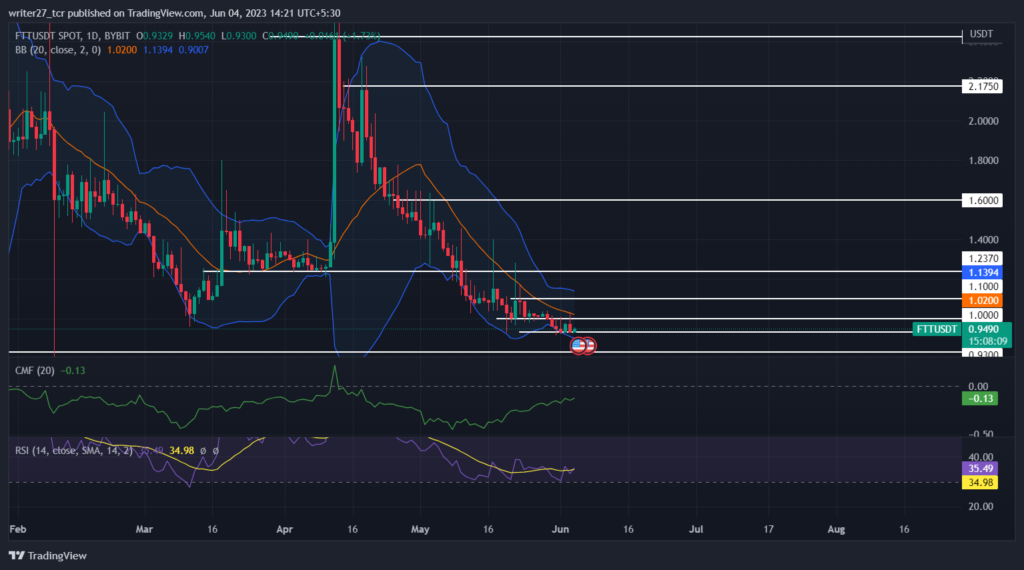
The bankrupt exchange token is already down -98.89% from the all-time high. FTT price trades below 20,50,100, and 200-day EMAs indicating bearish momentum. Chaikin money flow score is -0.13 suggesting weakness in the market.
CMF score has not crossed above the 0 mark since mid-April. RSI trades at 35.24, resisting to enter the oversold zone since May.
The 20-day SMA of Bollinger has been acting as a strong resistance for the price, and the price has been trading below it since the start of May. There are no signs of bullish sentiment in the market for FTT prices as of now. If the bulls are able to defend the recent support, the cryptocurrency price might retest the $1 high.
Conclusion
The market structure and price action for FTT price is highly bearish. The company has already filed for bankruptcy. Technical parameters indicate that the selling pressure is high on the price.
Technical levels
Major support: $0.93 and $0.83
Major resistance: $1 and $1.10
Disclaimer
The views and opinions stated by the author, or any people named in this article, are for informational purposes only. They do not establish financial, investment, or other advice. Investing in or trading crypto assets comes with a risk of financial loss.

Nancy J. Allen is a crypto enthusiast, with a major in macroeconomics and minor in business statistics. She believes that cryptocurrencies inspire people to be their own banks, and step aside from traditional monetary exchange systems. She is also intrigued by blockchain technology and its functioning. She frequently researches, and posts content on the top altcoins, their theoretical working principles and technical price predictions.


