
 Home
Home News
News

- 1 KLAY’s price is currently trading at $0.186 with a change in 24-hour trading volume of -17 percent.
- 2 KLAY’s price has been observing a decrease of 0.83% in the last 24 hours.
KLAY price has been trading under an ascending flag pattern. After trading within a bullish trend on the daily timeframe, the price saw a sudden decline after taking a rejection from the 200 EMA. After making a bearish double-bottom pattern the price lost 45% of its overall value.

The price is presently making an ascending channel pattern which is a forebearer of a bearish turn. According to the current price action, the value of the KLAY token may see a further decline in its value within the next few months. The volumes candlesticks are giving clear long red candles indicating that bears have a firm hold over the trend.

The current value of KLAY is $0.186 and it has a market of $576.53 Million
KLAY Price Sees a Decline in TVL
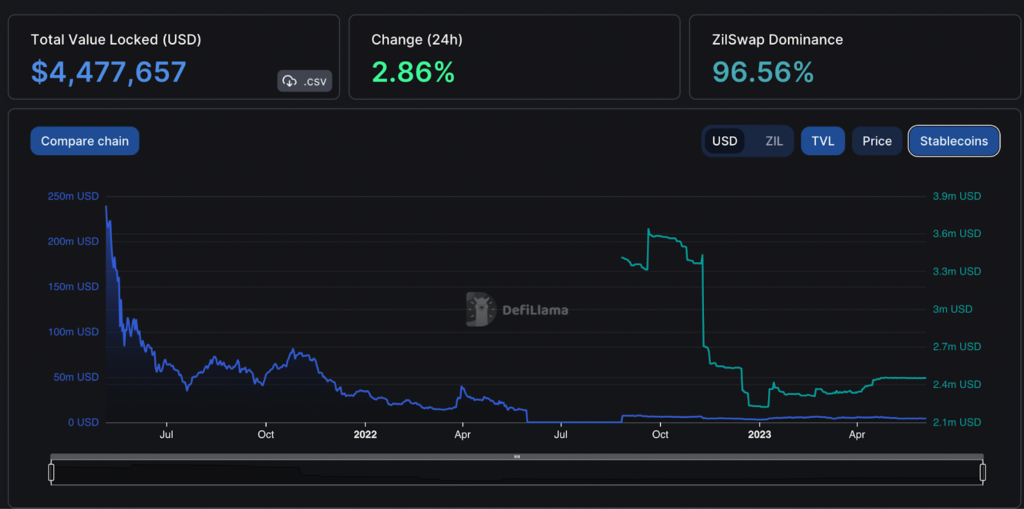
There is a slight increase in the TVL of KLAY after early January. Investors may need more reassurance in order to regain the buyer’s confidence. The current TVL of the KLAY coin is $4,477 Million which has surged by 2.86% in 24-hour trading value.
In a previous analysis, the price took a bullish turn after gaining the support of the buyers in mid-October. The bullish enthusiasm caused the price to surge up by more than 95%. Though the severe resistance of 200 EMA did not give any leeway to the price and the sellers overwhelmed KLAY seeing a fall of more than 56%.
Technical Analysis (1 Day Timeframe )
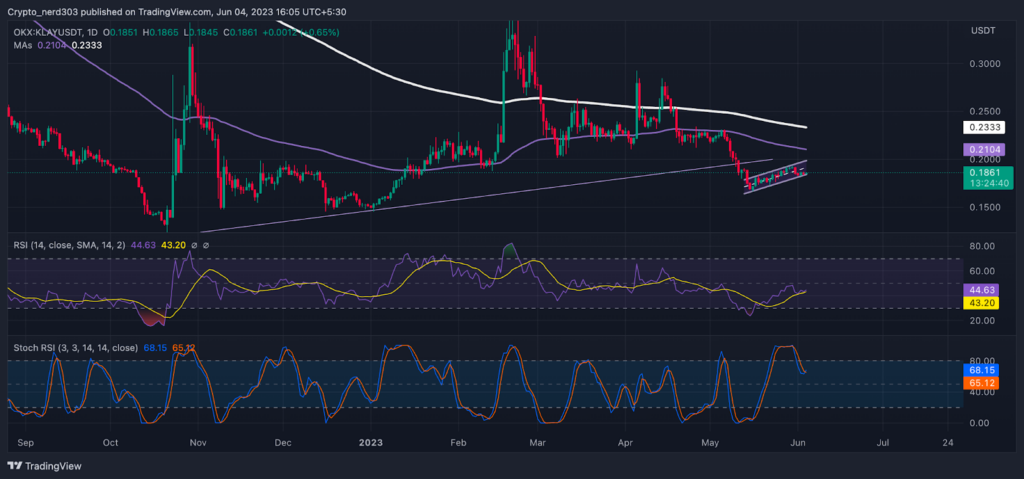
The RSI line may make a bullish curve after taking support from the 14 SMA. The value of the RSI line as of now is 44.63 points; the 14 SMA is providing support at 43.20 points. If the RSI line crosses above the median line and 14 SMA the price may take lead.
The stochastic RSI is taking a bullish reversal after taking rejection from the oversold levels. The %K line is crossing above the %D line on the daily timeframe. The present value of 68.15 points and it may soon give a crossover above the medium.
Conclusion
At present, the faster-moving average 20/50/100 EMA’s are acting as a barrier for KLAY’s price. The RSI line is making a bullish curve whereas the stochastic RSI is taking a bullish reversal after taking rejection from the oversold levels.
Technical levels –
Support -$0.1500 and $0.1000
Resistance – $0.2500 and $0.2000
Disclaimer
The views and opinions stated by the author, or any people named in this article, are for informational purposes only, and they do not establish financial, investment, or other advice. Investing in or trading crypto assets comes with a risk of financial loss.

Nancy J. Allen is a crypto enthusiast, with a major in macroeconomics and minor in business statistics. She believes that cryptocurrencies inspire people to be their own banks, and step aside from traditional monetary exchange systems. She is also intrigued by blockchain technology and its functioning. She frequently researches, and posts content on the top altcoins, their theoretical working principles and technical price predictions.


