
 Home
Home News
News

- 1 IOTA/USDT is currently trading at $0.1990 while seeing a significant change in total 24-hours of 80%.
- 2 IOTA price may be rejected from 100 EMA.
As predicted in the previous analysis the bulls were successful in salvaging the IOTA price, though the bears are not ready to accept the defeat, just yet. The price pattern indicates that the sellers are attempting to snatch the control back from the bulls.

The price recently gave a bullish breakout; making a double-bottom pattern near mid-May with a positive Doji candle gaining support from buyers near its current support level of $0.1700.

The price is currently making a bearish double-top pattern with a red engulfing candle. These candlestick patterns are often observed before the price makes a bearish reversal. If the sellers succeed in overpowering the buyers from current levels, it may see a downturn.
IOTA’s price has a total market cap of 553.35 Million, and its current Alt rank is 628th.
Sharp Appreciation in Total 24-Hour Trading Volume
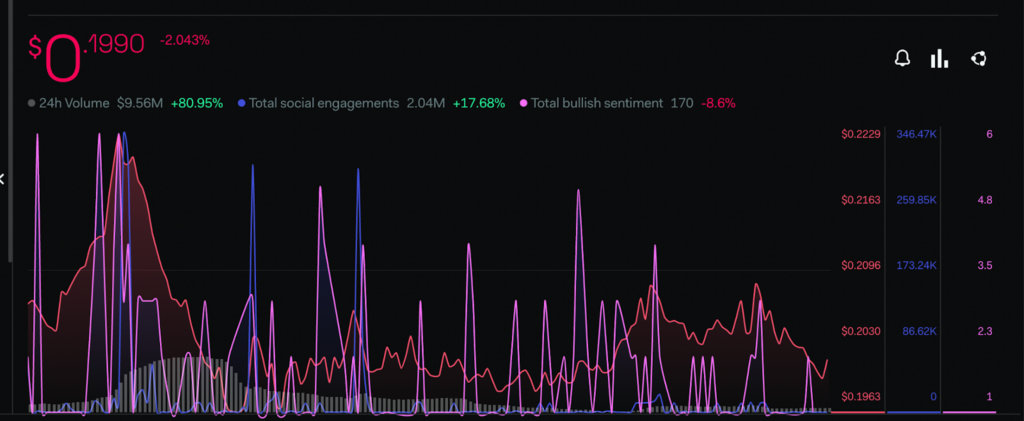
Investor sentiments seem to be observing a slight decline in the bullish sentiments regarding the IOTA token. The metrics forecast a bearish outlook regarding the future value of the token. The total bullish sentiment metric is seeing a decrease of 8.6%.
Despite the current pessimism, there is an increase of 80% in the 24-hour trading volume which indicates that the buyers and sellers are participating actively in the trading activity, according to the Lunar Crush platform.
IOTA Network is an open-source distributed ledger and cryptocurrency designed for the Internet of Things. The network operates a directed acyclic graph for storing the transaction on its ledger. The platform was initially released on 11 July 2016.
Technical Analysis (On 1 Day Time frame)

Presently, the price is making a double top pattern taking rejection from the 100 EMA. The IOTA price is trading below all the key EMA levels.
The RSI line is following the price action closely, signifying its strength. Presently, it is giving a negative interception to the %D line. The current RSI value is 53.65 points while the 14 SMA is trading just above it at 56.71 points.
The Stochastic RSI is already taking a negative reversal near the overbought level. The %K line indicates that it may soon give the median line a bearish interception, with the current value of the Stochastic RSI at 62.99 points.
Conclusion
As of now, according to the analysis, IOTA’s price after attaining its target is being overwhelmed by the sellers. The price is making a double-top pattern near the supply zone.
Technical levels –
Support – $0.1700
Resistance – $0.2000
Disclaimer
The views and opinions stated by the author, or any people named in this article, are for informational purposes only, and they do not establish financial, investment, or other advice. Investing in or trading crypto assets comes with a risk of financial loss.

Andrew is a blockchain developer who developed his interest in cryptocurrencies while pursuing his post-graduation major in blockchain development. He is a keen observer of details and shares his passion for writing, along with coding. His backend knowledge about blockchain helps him give a unique perspective to his writing skills, and a reliable craft at explaining the concepts such as blockchain programming, languages and token minting. He also frequently shares technical details and performance indicators of ICOs and IDOs.


