
 Home
Home News
News

- 1 UNI’s price is currently trading at $4.986 with a 15% drop in the 24-hour trading volume.
- 2 The price of UNI is seeing a decline of 6.42% in the last 24 hours, and may see a bullish reversal soon.
The price of the UNI token is presently trading near the demand zone on the daily timeframe. It has been gaining constant support from buyers in the last 11 months near the $4.700 price point. At present, the price of UNI is at a crucial support level, and can see a severe decline in its value if the sellers start to overpower the price at the current level.

The current price of UNI is $4.986 with its Market cap at $2.88 Billion.

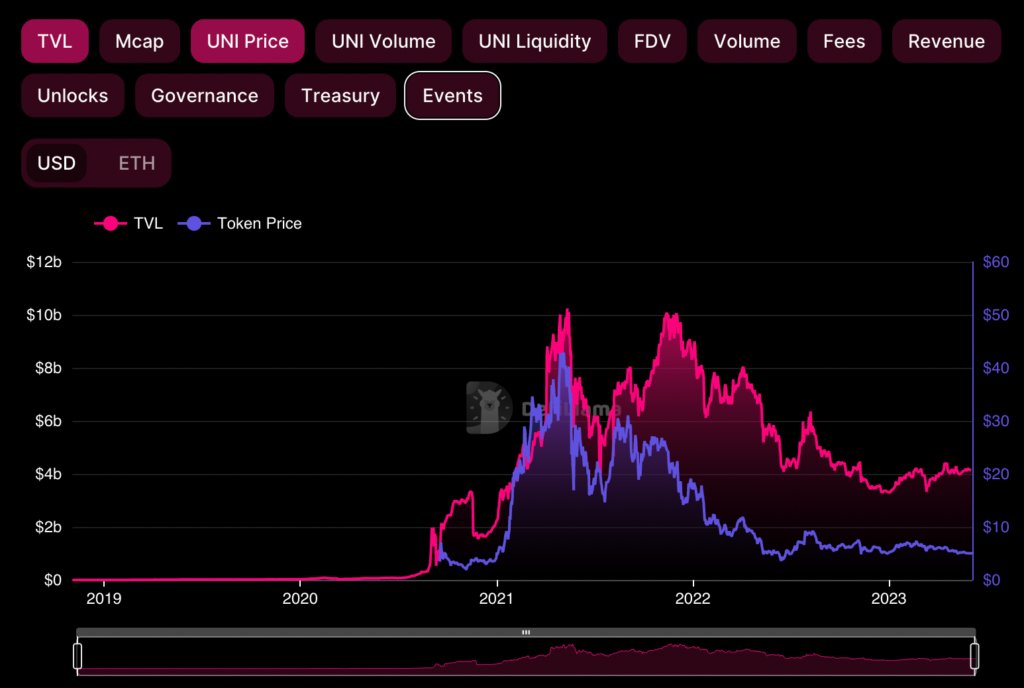
A Slight Rise in Revenue and TVL of UNI Token
In the previous analysis, it was estimated the price can continue to see a further decline after facing a rejection from $7.500 as the price makes strong red candles, whereas the RSI was reading under 14 SMA.
The UNI price did see a further decline in its value after which it made another attempt to rebound, which was vanquished by the sellers. The price broke its severe resistance levels, seeing a decline of 25% in its value.
Social Engagement and Bearish Sentiments in UNI Token
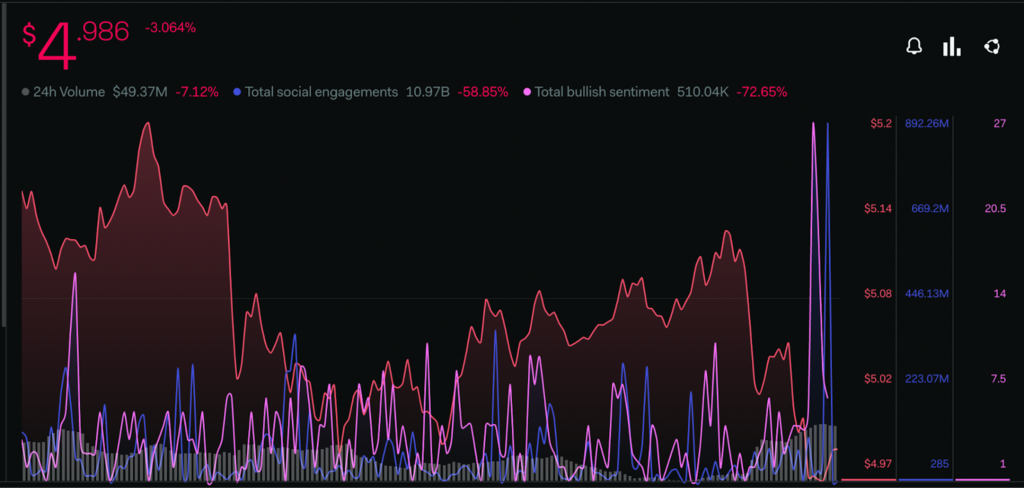
There is a substantial increase in the bearish sentiments of the investors within the past few weeks. The total bullish sentiment metric has declined by 72.65%, whereas the total social engagement is also seeing a decline of 58.85%.
The 24 volume has depreciated by 7.21% indicating a decrease in the buying and selling activity between the investors according to the LunarCrush. These metrics suggest that the sellers are prominent in the market.
Technical Analysis of UNI Price
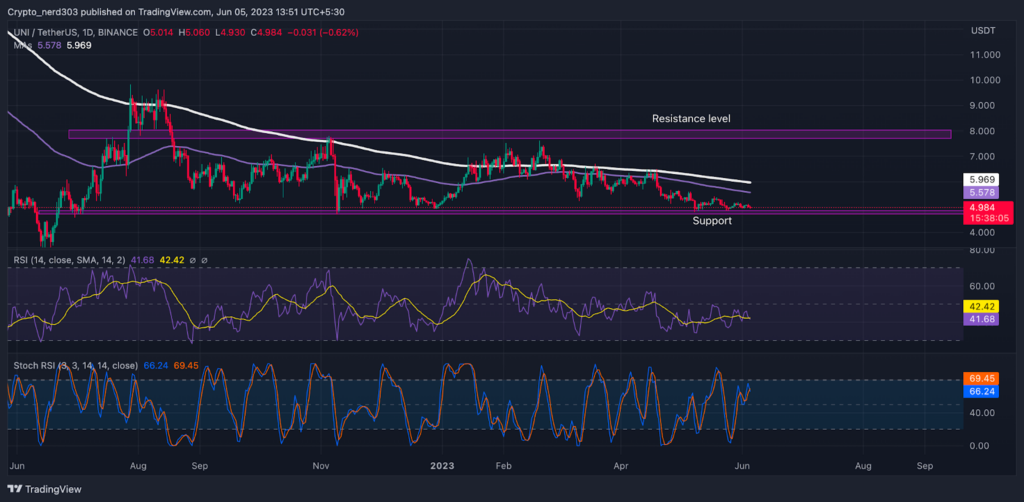
The RSI line has been taking constant resistance from the medium line. The current value of the RSI line is 41.68 points, whereas it takes rejection from the 14 SMA at around 42.42 points.
The stochastic RSI is making a double-top pattern near the supply zone. The %K line is taking a reversal from overbought points; and, the %D line is right behind it. The current value of Stochastic RSI is 28.20 points.
Conclusion
The price of UNI has been favoring the bears for the past few weeks. Observing the historical analysis, it can be estimated that buyers have been making constant efforts to break its long-term barrier near 200 EMA without success. It will require substantial support from the buyers in order to break its current boundation.
Technical levels
Support – $4.500
Resistance – $7.500
Disclaimer
The views and opinions stated by the author, or any people named in this article, are for informational purposes only and do not establish financial, investment, or other advice. Investing in or trading crypto assets comes with a risk of financial loss.

Nancy J. Allen is a crypto enthusiast, with a major in macroeconomics and minor in business statistics. She believes that cryptocurrencies inspire people to be their own banks, and step aside from traditional monetary exchange systems. She is also intrigued by blockchain technology and its functioning. She frequently researches, and posts content on the top altcoins, their theoretical working principles and technical price predictions.


