
 Home
Home News
News

- 1 ETC price is currently trading at $16.97 with a 30.78% drop in the 24-hour trading volume.
- 2 ETC price is down by 4.91% in the last 24 hours.
- 3 ETC price might see a reversal in the near future.
ETC price has been trading under the 200 EMA for the last few months. The bulls have made several attempts to break above the major resistance level however they have not been able to find any success as of yet. The price of ETC recently saw the exactly predicted fall of 24% within the last week.

At present, the price is trading near a crucial support zone on the daily timeframe. If the investors provide their support to the price from the current zone it can take a nifty surge of 21% within the near future.

Previously, a downfall of 24% was predicted If the price takes a rejection from the current level. Investor sentiment regarding the ETC price is in the fear zone.
Investors Showing Bullish Optimism
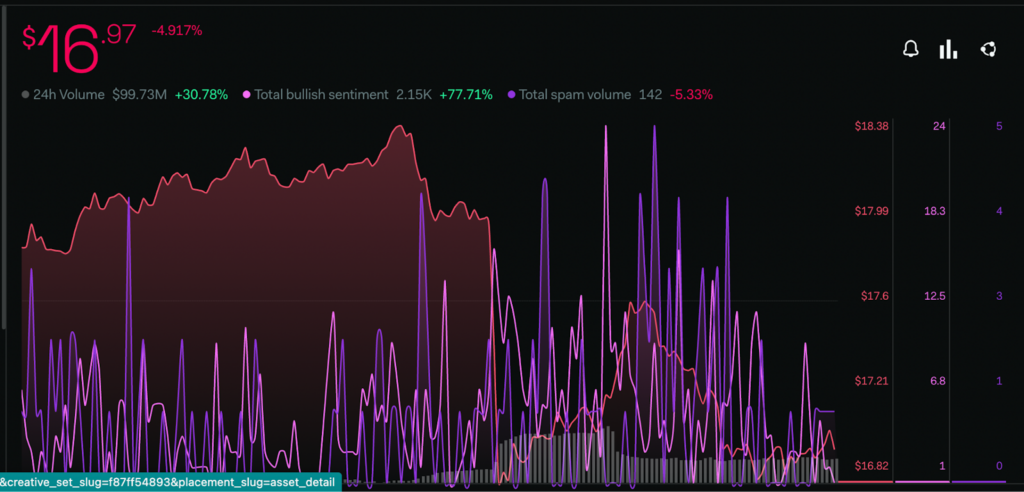
Investor sentiment forecast an optimistic turn regarding the future trend according to LunarCrush. The total bullish sentiment metric has escalated by 77.71%, whereas the bearish sentiments have declined by 28.2% supporting the investor’s view.
The 24 volume has gone up by 30.78%, indicating an incline in the buying and selling activity among investors.
Neutral Movement In Market Sentiment
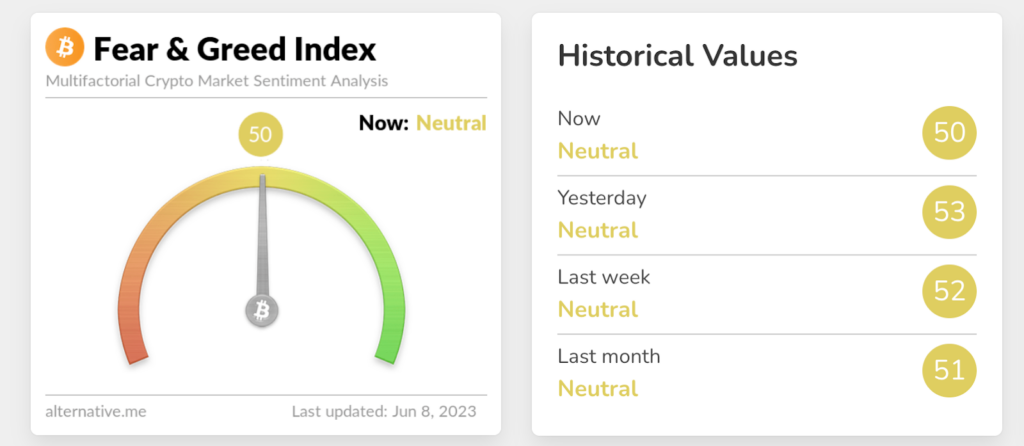
After seeing a significant surge within a short period of time, the majority of market sentiments are moving near neutral level. The current value of market sentiment is 50, according to the Fear and Greed Index. There has been a slight decrease in value since last month.
Technical Analysis of ETC Price
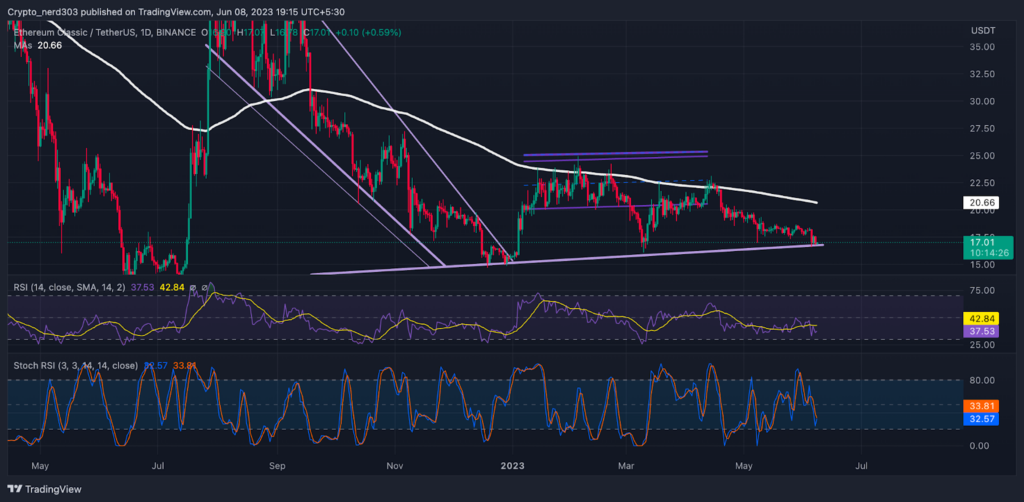
The RSI line is at present trading below the median after taking rejection from 14 SMA. The RSI line is moving near 37.53 points and the 14 SMA is providing resistance to it around 42.84 points.
The stochastic RSI is approaching the demand zone on a daily time frame. Presently, the %K line is crossing over the %D line near 32.57 points. Stochastic RSI recently intercepted above the 30 RSI points suggesting a bullish turn of trend.
The price of ETC is at present facing a barrier from major EMA and MA levels. The oscillators are approaching the demand zone. Currently, the Investor’s sentiments regarding the ETC price are trading in the fear zone

With a background in journalism, Ritika Sharma has worked with many reputed media firms focusing on general news such as politics and crime. She joined The Coin Republic as a reporter for crypto, and found a great passion for cryptocurrency, Web3, NFTs and other digital assets. She spends a lot of time researching and delving deeper into these concepts around the clock, and is a strong advocate for women in STEM.


