
 Home
Home News
News

- 1 The stock showcased a double bottom formation and is trying for a pullback.
- 2 Buyers have kept the gains and are looking to escape the 20-day EMA mark.
The BTBT (NASDAQ: BTBT) stock has nailed the gains and made a double-bottom formation near $2.20, reciting a pullback on the charts. Moreover, the stock has terminated the correction and witnessed a hammer candlestick followed by a bullish marubozu candle, which confirms the reversal for the following sessions. However, the stock must overtake the 100-day EMA mark above $3 to acquire the buying momentum.

Bit Digital Inc. (NASDAQ: BTBT) signifies a sharp throwback from the highs of $5.25 and corrected over 50% in the last weeks. However, a sharp bounce from the lows of $2.40 was noted, which trapped the sellers. Additionally, the stock is ready to extend the rebound and may surpass $3 soon. With the rebound recorded in Bitcoin, BTBT stock and other crypto stocks outperformed the market and noted buying interest in yesterday’s session.

At Thursday’s closing, BTBT price was at $2.74, with an intraday gain of 12.76%, showing a pullback in the last session. The trading volume is at 8.65 Million and the market cap is $232.98 Million. Analysts are bullish and suggest a buy rating with a yearly target price of $5.73, suggesting an overweight rating. The stock has a return ratio of (-25.14%), whereas (+ 85.14%) on a yearly basis.
BTBT on Daily Charts Displays Double Bottom Formation
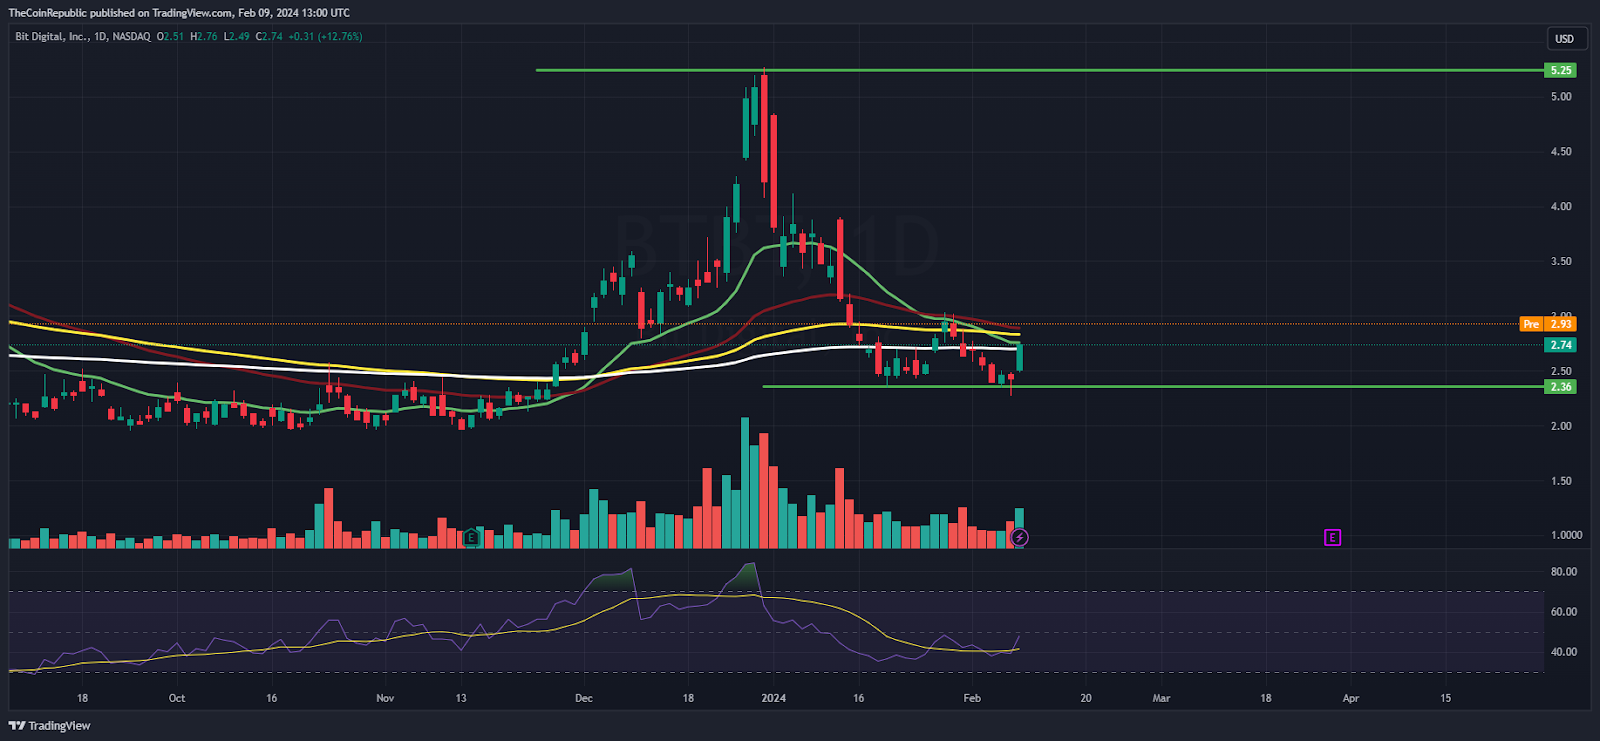
On the daily charts, the stock noted a sharp surge and climbed over 12%, glimpsing a bullish reversal pattern. Moreover, the stock noted a gap of 7% during the pre-market session and may continue to rebound in the upcoming sessions. The stock has done its correction and may acquire strength above $3 soon. The option chain data indicates a massive increase in open interest of 23% to 2058 hundred shares at the put side, signifying the short-covering move.
The Relative Strength Index (RSI) curve sharply rose from the overbought zone and reached the neutral zone, indicating the short covering move. Moreover, the MACD indicator shows a bullish crossover and noted a reversal from the lows.
BTBT on Weekly Charts Exhibits Cup and Handle Formation
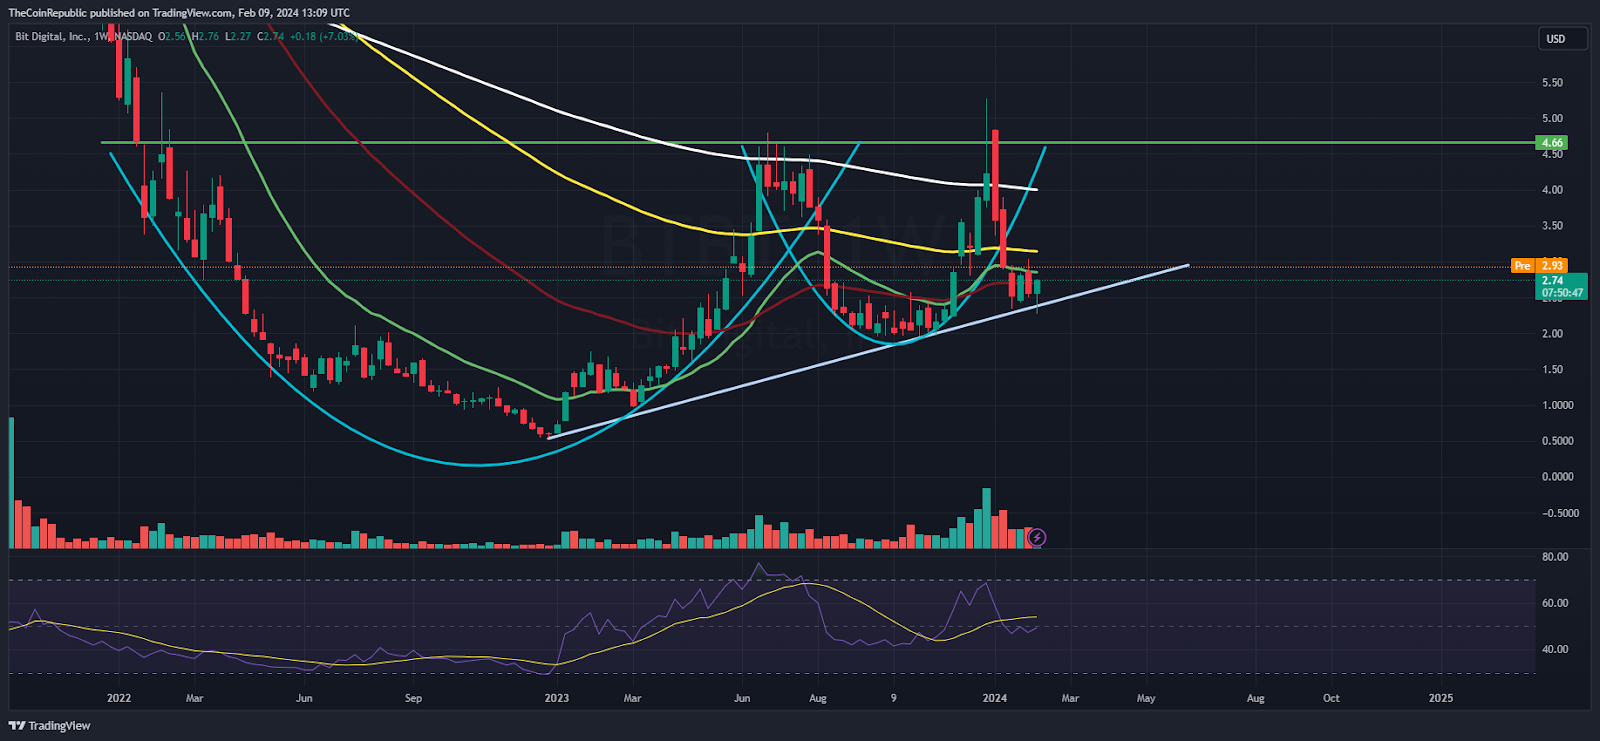
On the weekly charts, the BTBT stock noted a cup and handle pattern but failed to register a breakout above the supply zone of $5.50 and pushed toward its demand zone. Meanwhile, the stock took support on its upward trendline near $2.10 and formed a hammer candlestick, which signifies the reversal for the coming sessions.
Summary
Bit Digital Inc. (BTBT) stock noted a base formation and is ready to sparkle the gains amidst the correction from the highs. The stock is ready for a bounceback and may acquire bullishness above the prompt hurdle of $3, which may trigger the upward move toward $4 in the following sessions.
Technical Levels
Support Levels: $2.30 and $2
Resistance Levels:$3 and $3.20
Disclaimer
The views and opinions stated by the author or any other person named in this article are for informational purposes only and do not constitute financial, investment, or other advice. Investing in or trading crypto or stocks comes with a risk of financial loss.
Anurag is working as a fundamental writer for The Coin Republic since 2021. He likes to exercise his curious muscles and research deep into a topic. Though he covers various aspects of the crypto industry, he is quite passionate about the Web3, NFTs, Gaming, and Metaverse, and envisions them as the future of the (digital) economy. A reader & writer at heart, he calls himself an “average guitar player” and a fun footballer.


