
 Home
Home News
News
- 1 The Litecoin coin’s price decreased by 7.28% over the last week and is trading below major EMA’s.
- 2 The price of the LTC coin is trading at $63.26 and the 52-week trading range is $47 – $114.
Litecoin network uses LTC as its original token, a cryptocurrency that was created from Bitcoin in 2011. LTC is more scalable, cheaper, and faster than Bitcoin, and has a higher supply of 84 Million LTCs. LTC has a strong community and is widely accepted by merchants.

Litecoin (LTC) open interest is $226.16 Million, as per Coinglass, which is a crypto analysis website, it fell by 2.84% in the previous session. The long versus short ratio for 24 hours is 0.9643. The total number of short positions added in the last 24 hours is $14,977.793 against longs of $271,975.14.

LTC crypto plummeted by 1.89% in market value and by 3.92% in trading volume in the last 24 hours, per Coinmarketcap, which is also a crypto data and info website. Its market value is $4,742,335,137 and its trading volume is $163,218,659. There are 73,741,802 LTC in circulation.
LTC Coin Price Technical Analysis in the 1-Day Timeframe
LTC coin has performed well this month, as it has increased by 2.83% in its price. However, it has suffered a significant loss of 31.75% in the past six months, indicating a bearish trend. The year-to-date return of LTC price is also negative, as it has declined by 8.21% since the beginning of the year.
Therefore, the LTC price could continue to move downwards and form new support at $59 and $54. If it fails to maintain the current level.However, if the LTC price sustains the current level and rises above the previous swing high, then it might hit and reclaim previous resistance levels of $68 and $72.
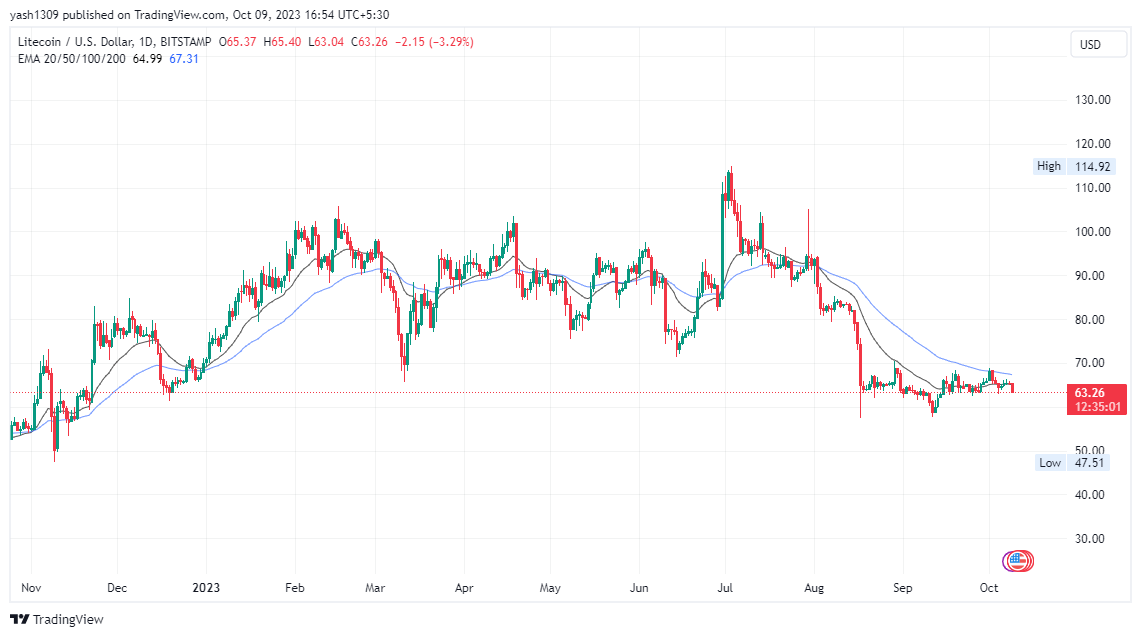
At the time of publishing, Litecoin (BITSTAMP: LTC) is trading below the 20 and 50-day EMAs (exponential moving averages).
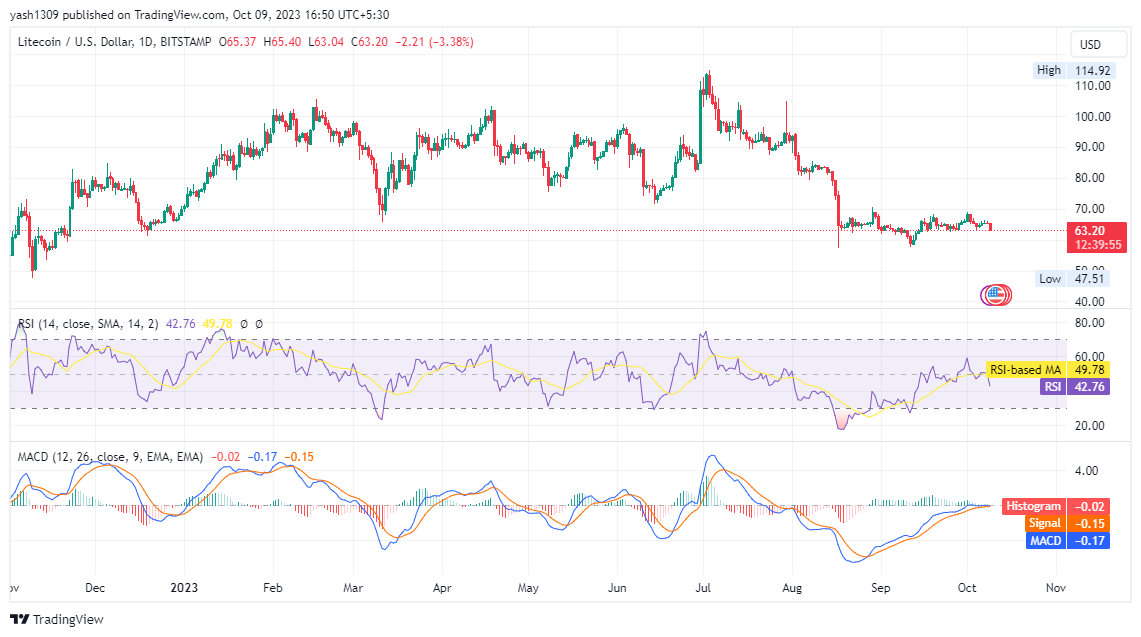
The MACD line at 0.17 and the signal line at 0.15 are below the zero line. Both lines cross each other showing a bear crossover is observed in the MACD oscillator, where the histogram width is lean indicating price consolidation or trend continuation.
The current value of the RSI is 42.70 points and the 14-day SMA is below the median line at 49.77 points.
In addition, Litecoin (LTC) has a maximum market cap of $5,400,270,826, which is the fully diluted valuation (FDV) of the cryptocurrency. This is based on the assumption that all 84 Million LTC tokens are circulating in the market today. However, the actual number of LTC tokens in circulation may be lower, depending on how the LTC tokens are emitted over time. Therefore, it may take several years before the FDV is achieved.
Conclusion
LTC price highlights the neutral to bearish sentiments and perspectives of investors and traders regarding the LTC in the daily time frame. The technical parameters of the LTC price suggest the continuation of the bearishness over the daily time frame chart. Moreover, LTC price action highlights a bearish to consolidation view at the time of publishing.
Technical Levels:
- Support levels: $59 and $54.
- Resistance levels: $68 and $72.
Disclaimer
In this article, the views and opinions stated by the author, or any people named are for informational purposes only, and they don’t establish the investment, financial, or any other advice. Trading or investing in cryptocurrency assets comes with a risk of financial loss.

With a background in journalism, Ritika Sharma has worked with many reputed media firms focusing on general news such as politics and crime. She joined The Coin Republic as a reporter for crypto, and found a great passion for cryptocurrency, Web3, NFTs and other digital assets. She spends a lot of time researching and delving deeper into these concepts around the clock, and is a strong advocate for women in STEM.


